
Viktoriia Malyshkina – Paid Advertising on Google Ads
Business Overview
Website Profile: This e-commerce platform boasts an extensive catalog, featuring 20,000 products across 60 diverse categories.
Business Objective: The primary goal is to escalate revenue by 50%, while achieving an impressive Return on Ad Spend (ROAS) of 700%.
Campaign Strategy: The focus is on implementing Performance Max campaigns on Google to drive these ambitious growth targets.
Strategy Concept
The image below illustrates a hierarchical campaign structure for a Performance Max campaign, segmented into three distinct layers. The topmost layer is designated for ‘High Margin’ products, indicating a focus on items that yield the greatest profit. This branches into two mid-tier layers, ‘Product Category #1’ and ‘Product Category #2’, suggesting a categorization strategy within the high-margin segment. Each product category further bifurcates into three components: ‘Products’, ‘Assets’, and ‘Signals’. ‘Products’ likely refers to the individual items within each category. ‘Assets’ encompass the marketing materials used across various platforms, and ‘Signals’ represent targeted marketing strategies and themes.
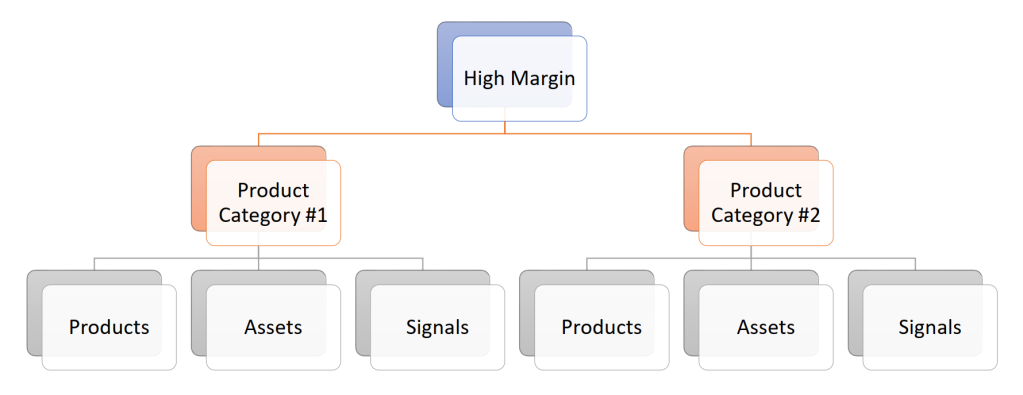
- Primary Campaign Layer: Product Margin Classification – This layer categorizes products into three distinct margin levels: High, Medium, and Low.
- Second Campaign Layer: Product Categories – This tier involves the strategic identification of product categories, each distinguished by a specific value assigned to custom labels in the feed file within Google Merchant Center.
- Final Campaign Layer: Products, Assets, and Google Signals – This foundational layer encompasses products tagged with custom labels correlating to their respective categories. It includes a range of assets such as copy, images, and videos tailored for cross-network advertising. Additionally, this layer leverages Google Signals to define specific targeting strategies and thematic directions for the advertisements.
The Results Of Analysis For Last 28 Days
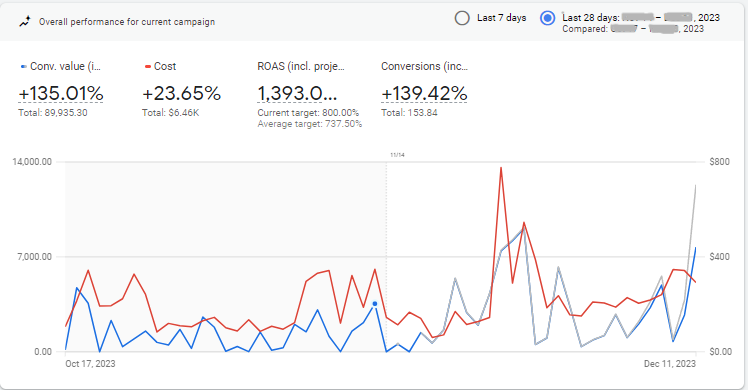
Source: Google Ads
Interpretation
Revenue (Conv. Value). There has been a substantial increase of 135.01% in the conversion value, bringing the total to $89,935.30. This indicates a significant growth in the revenue or value generated from conversions.
Cost. The cost has gone up by 23.65%, with a total spend of $6.46K. This increase is modest compared to the surge in conversion value, suggesting the campaign has become more efficient.
ROAS. The ROAS is extremely high at 1,393.0%, exceeding the current target of 800.00% and the average target of 737.50%.
Conversions. Conversions have increased by 139.42%, totaling 153.84. We have this significant jump because campaign was created recently, and we do not have a data for the previous period.
The campaign has achieved a very high ROAS, significantly above both the current and average targets.


Leave a comment