Minute-by-minute: Football League tables
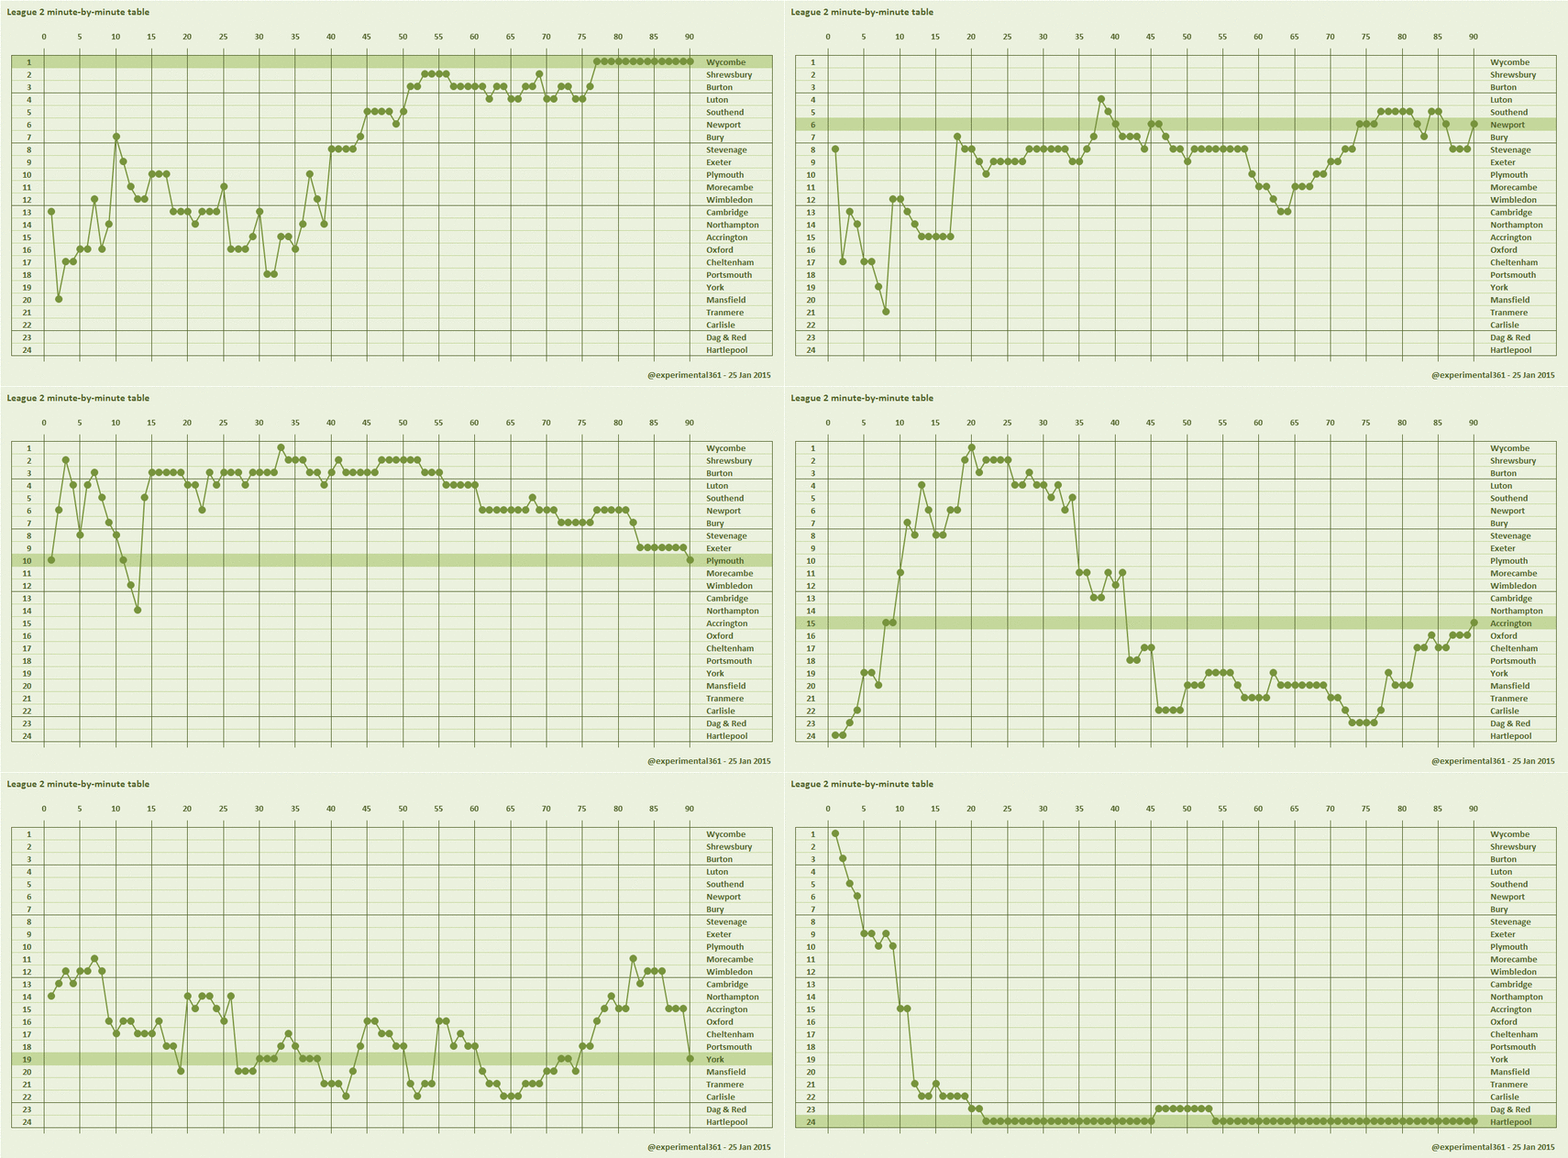
Following on from yesterday’s successful test (read: no significantly hurtful abuse received), I’ve built animated GIF versions of minute-by-minute tables for all 3 Football League divisions.
The way these work is as follows:
- Each graphic cycles through every club in a division in descending order of their current league position (on an infinite loop with each frame lasting 2 seconds).
- The line shows what the highlighted club’s league position would have been in an imaginary universe where every match in the division finished early, for each scenario from the 1st to the 90th minute (as per the scale at the top).
- I’ve chopped the time up into 5 minute segments to make it easier to read, and for simplicity’s sake I’ve rolled all injury time into the 45th and 90th minutes.
- This means that the last dot on each line is just each club’s normal league position, and the clubs are in the same order as in the real table.
- The idea behind these is that you can identify clubs that perform particularly well or badly at various points during matches and measure how much this is affecting their league position.
Without further ado, here they are – along with some observations for each. Clicking a graphic will bring up a full-sized version in a new tab (EDIT – thanks to @bootifulgame for pointing out that I can use gfycat to create pause-able, rewind-able versions):
Championship
- Ipswich are having a great season but they tend to start matches late: poor until around the 18 minute mark when they suddenly find another gear.
- High-fliers Derby, Watford and Norwich are also slow starters: each among the worst performers early on but quickly asserting themselves thereafter.
- Nottingham Forest would be in chaos if matches were only 70 minutes long – they’re the division’s worst performers after 36 minutes, in the relegation zone up to the 71st and only 18th after 89: it’s those last-minute goals which are keeping them in the top half of the table.
League 1
- Sheffield United would be faring much, much worse without their knack of scoring late. Nobody can better their haul of 12 goals in the last 10 minutes of matches, without which they’d be in the relegation zone rather than 8th.
- In contrast, Oldham are probably wishing matches finished earlier: after 89 minutes they’re the 7th best performers in the division, but that final minute and the associated injury time pushes them down to 14th. Gillingham have the same problem – they drop from 8th in the 89th minute to 16th at full time.
- As Chelsea discovered at the weekend, Bradford get a lot more dangerous as a game progresses. The Bantams look a relatively mid-table side after the first half hour, but suddenly burst into life just before half time and don’t look back.
League 2
- Current leaders Wycombe are much more impressive after half time than before it – if only first halves counted then they’d just be scraping into the play-offs.
- Conversely, Wimbledon have enjoyed better first halves than anyone else in the division – they’d be top rather than mid-table if we did away with second halves this season.
- Second bottom Dagenham & Redbridge actually sustain a level of performance akin to a top half side up until around the 80th minute, at which point things tend to unravel very quickly.


Pingback: Let's all make the Football League alphabetical - Sky Blues Blog
Pingback: Minute-by-minute table: Vanarama Conference | Experimental 3-6-1
Pingback: Minute-by-minute table: League 2 | Experimental 3-6-1
Pingback: Minute-by-minute table: League 1 | Experimental 3-6-1