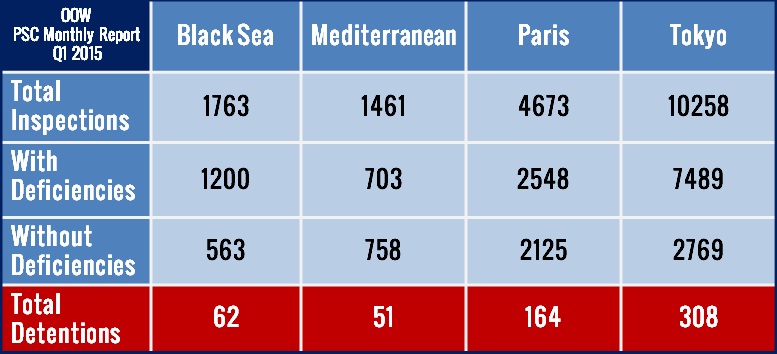
The PSC Report that was published in the past by OOW has been updated and from now on will be released on a quarterly basis. The updated report focuses mainly on the locations where the majority of the PSC detentions took place in the past quarter. As it can be seen from the report the majority of the PSC detentions takes place in the Tokyo PSC MoU, followed by Paris PSC MoU. This is something to be expected taking into consideration the amount of merchant vessels that visit Indian/Pacific ocean area as well as the Europe area.

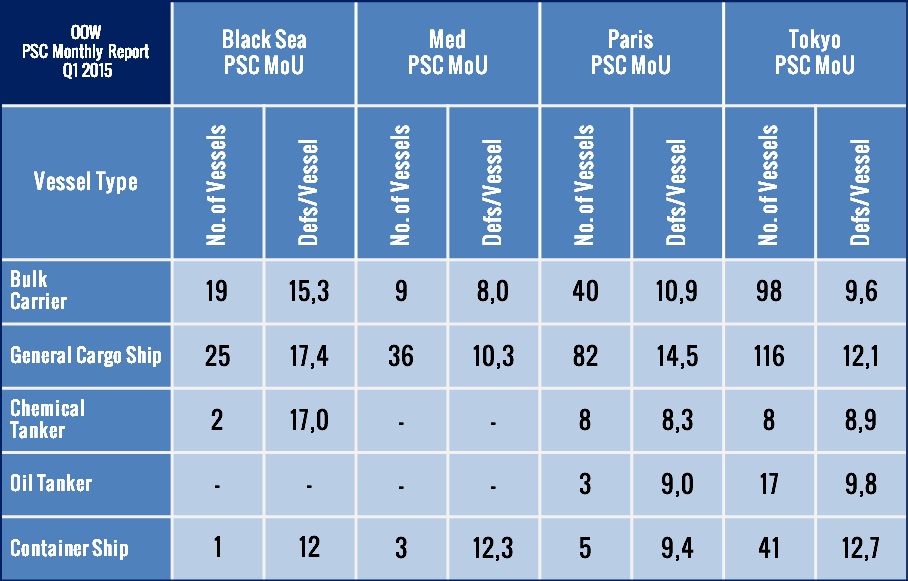
From the types of vessels that are analyzed within the report those that are “more prone” to detentions are the General Cargo Ships and the Bulk Carriers. A trend which is not new and which is also expected since these types of Vessels are not subjected to any other 3rd party inspections apart from PSC and the usual Statutory/Class audits/surveys. On the other hand detention numbers for tankers in general are much lower maybe due to the fact that these types of vessels since they are subject to vetting inspections by oil companies are more well maintained and ready for inspections.
In the images below, the ports where most of the detentions took place per PSC MoU areas are being shown. These illustrations can help in giving an idea of the most “strict” ports and also highlight the importance of having a well prepared ship visiting these places. Of course it should be kept in mind that the numbers below are only an indication and an increased number in PSC detentions does not necessarily mean that a vessel has higher possibilities of getting detained if she calls to one of these ports. For example one port may have an increased number of merchant vessels visits thus the increased number of inspections and relevant detentions.
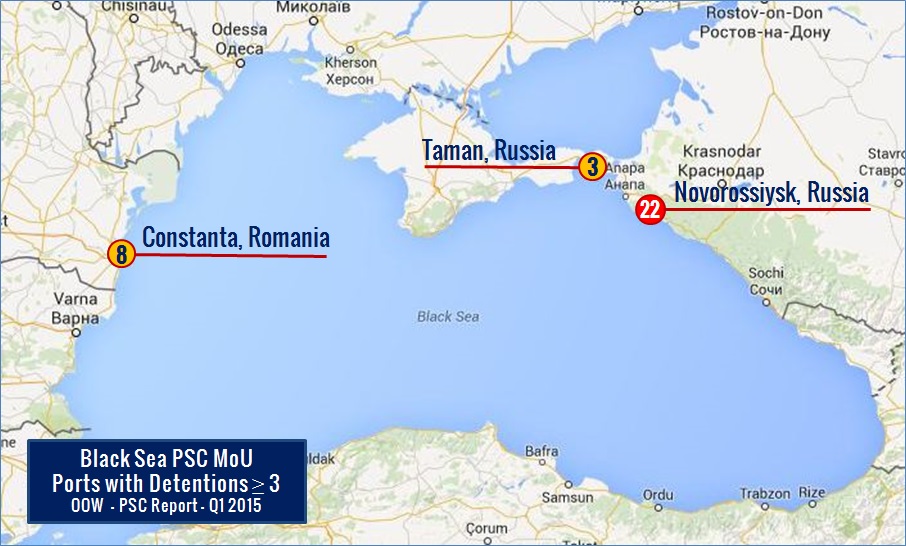
For the Black Sea PSC MoU the place with the highest number of detentions is Novorossiysk in Russia where for Q1 of 2015 a total of 22 detentions were recorded. Constanta in Romania recorded 8 detentions and Taman in Russia 3 detentions. More than half of the total detentions in Black Sea PSC MoU were recorded in the places mentioned above.
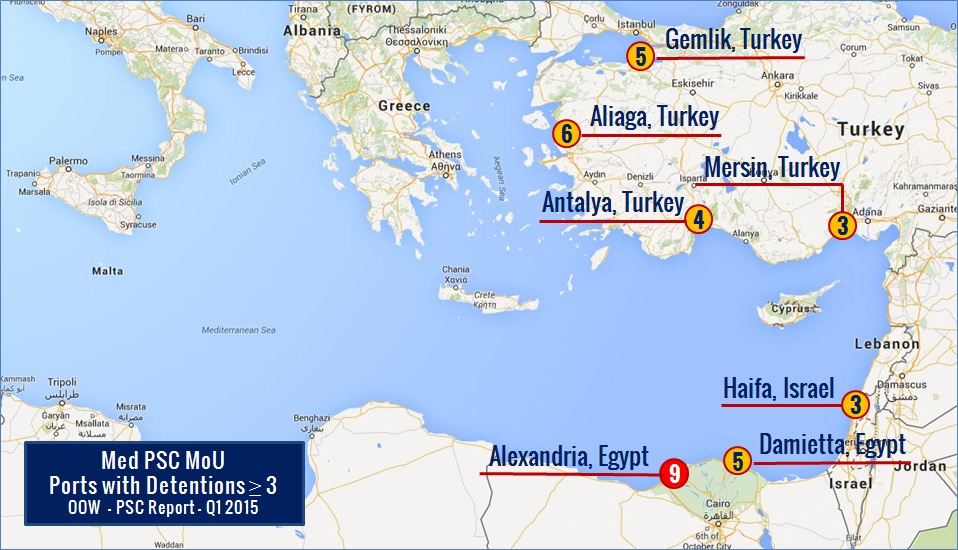
In the Mediterranean PSC MoU Alexandria in Egypt recorded most of the detentions for Q1 2015. More specifically 9 detentions took place in Alexandria while 5 detentions took place in Damietta, Egypt. Other places worth mentioning is Aliaga (6), Gemlik (5), Antalya (4), Mersin (3) in Turkey and Haifa in Israel with 3 detentions.
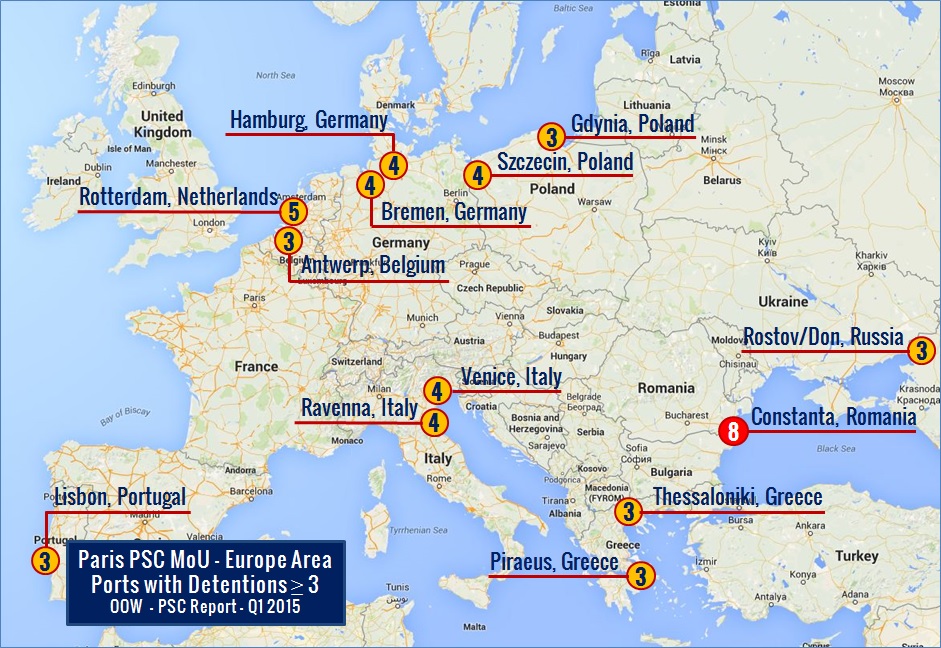
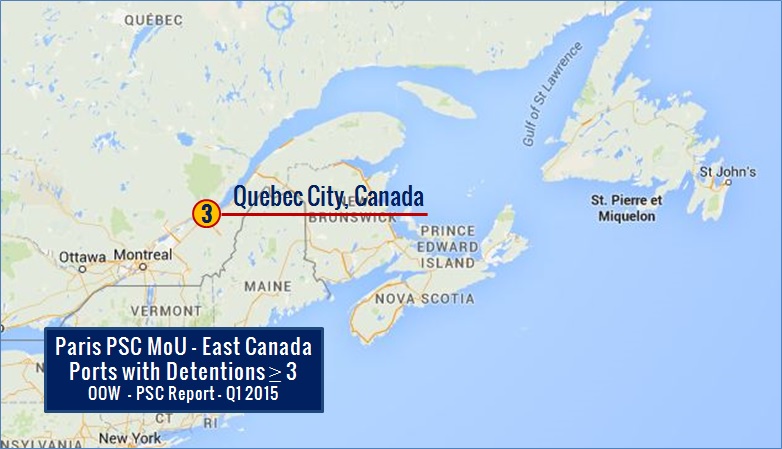
For the Paris PSC MoU area most of the detentions were recorded in ports of North Europe, Rotterdam (5), Bremen (4), Hamburg (4), Szczecin (4), Gdynia (3), Antwerp (3). In Southern Europe detentions were recorded in Venice (4), Ravenna (4), Lisbon (3), Piraeus (3), Thessaloniki (3). The port with the highest number of detentions is Constanta in Romania with 8 detentions, it should be noted that Romania as a country participates both in the Paris PSC MoU as well as in the Black Sea PSC MoU and thus relevant data were the same in the databases of the Paris and Black Sea PSC MoUs. In these cases one practical question that one may ask is “What type of report does the PSCO leaves onboard? A PSC Report of the Paris MoU or of the Black Sea MoU or both?”. Finally 3 detentions were recorded in Canada’s Quebec City.
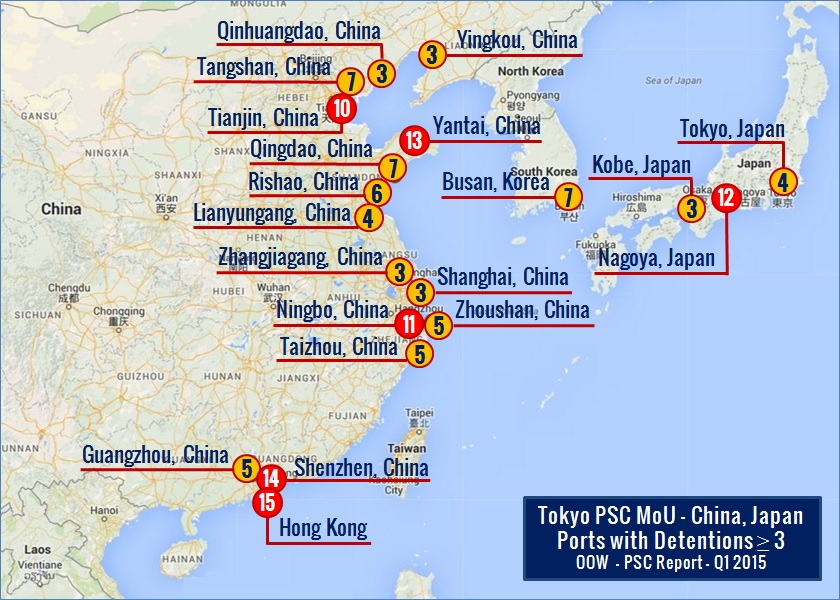
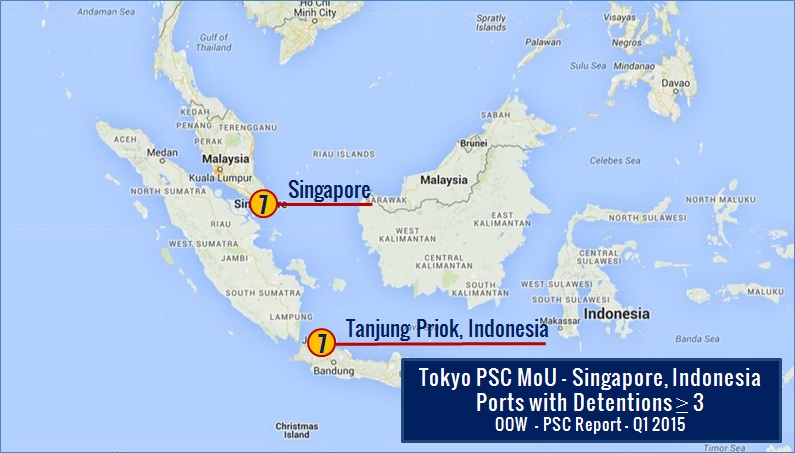
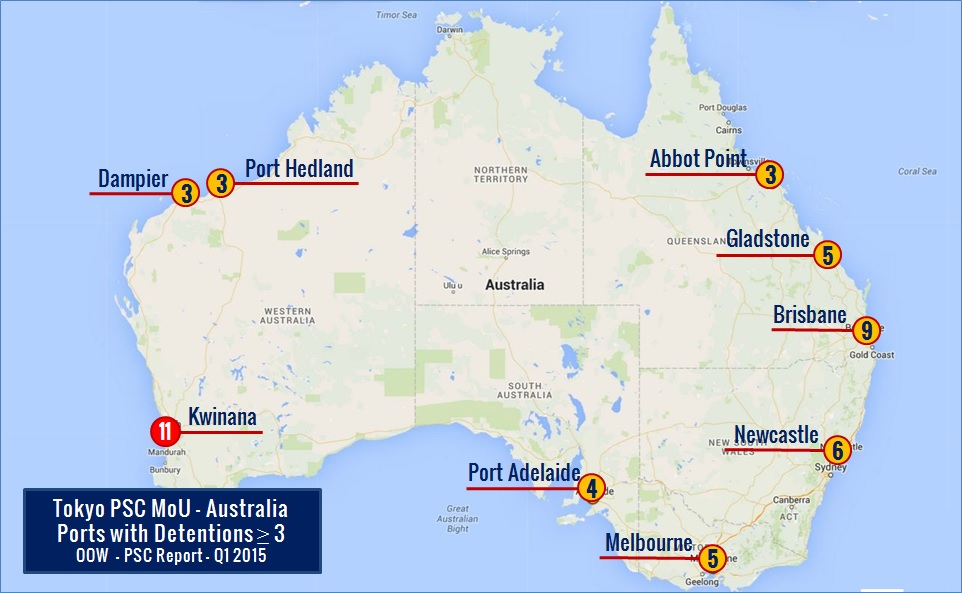
As it can be seen from the illustrations above in the Tokyo PSC MoU area one of the most active countries in terms of detaining vessels is China. There were 15 ports which recorded more than 3 detentions for Q1 2015 and it is also worth mentioning that some of them recorded well above 10 detentions. These were Shenzhen (14), Yantai (13), Ningbo (11), Tianjin (10). Hong Kong recorded 15 detentions in total which is the highest number in the entire Tokyo MoU. In Japan, it is worth mentioning that there were 12 detentions for Q1 2015. In Singapore there were 7 detentions and in Tanjung Priok 7 detentions as well. In Australia (AMSA), a fair amount of detentions was recorded with Kwinana port being the one with the highest number (11 detentions).
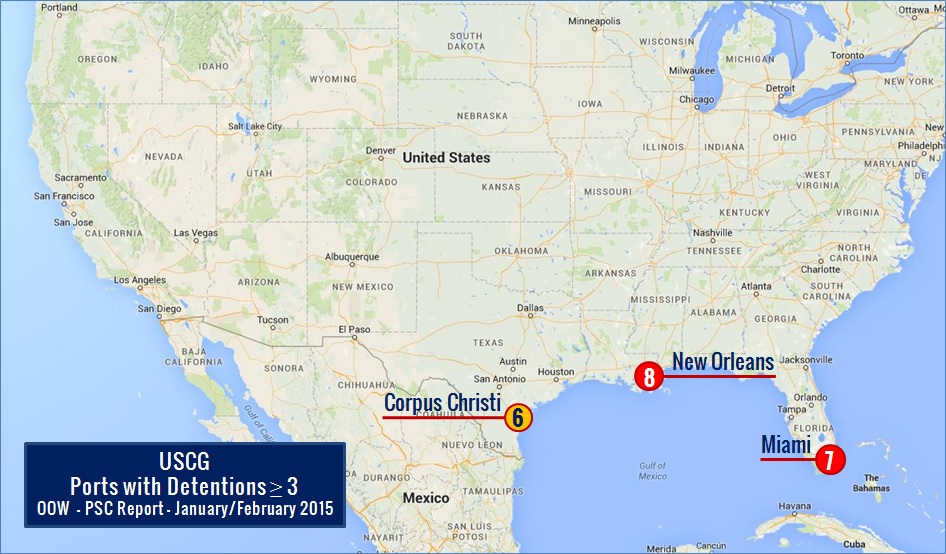
In USA, until the date this report was published, for Q1 2015 over half of the vessels’ detentions were recorded in the following places: New Orleans (8), Miami (7) and Corpus Christi (6). In total there were 32 detentions in the USA for Q1 2015. It is worth mentioning that the USCG publishes a report with the vessels that have been detained on a monthly basis. In this particular report one can find detailed information about each detention.
To the best of our knowledge, USCG is one of the few PSC authorities that publishes the description of each deficiency for inspections of detained vessels. This is to the USCG’s honor and it is a practice that helps better understand what standards are expected from vessels inspected by USCG, not to mention that it also adds points to the transparency of PSC inspections. Moreover, USCG also publishes a list of targeted, in terms of safety compliance, Ship Charterers and Ship Managers and surely an organization does not want to be in that list since it means more frequent and detailed inspections for associated vessels. Such practices can greatly help in identifying “substandard” Charterers and Ship Managers. Similar lists are also published by other PSC authorities (see links at the end of the report).
Apart from the USCG other PSC MoUs do not publish, at least for detained vessels, the description of the imposed deficiencies. The only relevant information to the general public is just the category under which the deficiency falls, which of course does not mean anything special since it does not give any clue on what exactly the PSCO observed onboard. If the description of the deficiency was published, this would greatly enhance the understanding of the involved stakeholders on what can be done to prevent similar deficiencies in the future, and in addition it would add extra credibility in terms of transparency of PSC inspections and professionalism of PSCOs.
The information contained in this report have been gathered mainly from PSC MoUs websites as well as from various Coast Guard Authorities and may serve only as reference for the inspections being carried out onboard merchant vessels. The consistency of the information may differ between MoU since there are slight differences on the way each organization presents the inspection info as well as due to the fact that some countries are member in more than one PSC MoU.
Please click the following link in order to download the full report OOW PSC Quarterly Report 2015 Q1. The PDF version of this report can be also found in the OOW profile in Scribd and is also embedded down below for easy reference.
Sources used for the development of this report:
- Caribbean MoU
- Black Sea MoU
- Mediterranean MoU
- Vina del Mar
- Abuja MoU
- Indian Ocean MoU
- Paris MoU
- Tokyo MoU
- Riyadh MoU
- USCG
- AMSA
- Transport Canada


Leave a Comment