Solana price started a downside correction from the 0 zone against the US Dollar. The price is now trading above 0 and the 55 simple moving average (4 hours). There was a break below a key bullish trend line with support at 2 on the 4-hour chart of the SOL/USD pair (data feed from Coinbase). The pair must stay above the 8 and 5 support levels to start another increase. Solana price is correcting gains from 0 against the US Dollar, like Bitcoin. SOL could start another increase if the bulls remain active above 5. Solana (SOL) Price Analysis SOL price attempted more upsides above the 0 resistance zone. The price climbed above the 5 zone, but the bears were active near the 0 zone. A high was formed near 9.38 before there was a
Topics:
Aayush Jindal considers the following as important: Altcoin News, News, sol, solana, Trading
This could be interesting, too:
staff writer writes Massive 5M in Token Unlocks Set to Shake Up Market in June
Anisha Pandey writes Bitdeer Announces Up to 0M in Private Placement Financing
Chimamanda U. Martha writes Donald Trump Amasses M in Crypto after Legal Battle
Godfrey Benjamin writes Mike Novogratz Predicts Staking for Spot Ethereum ETFs in 2 Years
- Solana price started a downside correction from the $160 zone against the US Dollar.
- The price is now trading above $140 and the 55 simple moving average (4 hours).
- There was a break below a key bullish trend line with support at $152 on the 4-hour chart of the SOL/USD pair (data feed from Coinbase).
- The pair must stay above the $138 and $135 support levels to start another increase.
Solana price is correcting gains from $160 against the US Dollar, like Bitcoin. SOL could start another increase if the bulls remain active above $135.
Solana (SOL) Price Analysis
SOL price attempted more upsides above the $150 resistance zone. The price climbed above the $155 zone, but the bears were active near the $160 zone.
A high was formed near $159.38 before there was a downside correction. The price declined below the $152.50 support zone. There was a break below a key bullish trend line with support at $152 on the 4-hour chart of the SOL/USD pair.
The bears were able to push the price below the 23.6% Fib retracement level of the upward wave from the $118 swing low to the $160 high. It is now trading above $140 and the 55 simple moving average (4 hours).
On the downside, initial support is near the $145 level. The next major support is near the $138 level or the 50% Fib retracement level of the upward wave from the $118 swing low to the $160 high. The main support sits at the $135 level.
A downside break below the $135 support level might spark a sharp decline. In the stated case, the price may perhaps decline toward the $122 level. Any more losses might call for a test of $118.
On the upside, immediate resistance is near the $158 level. The next major resistance is near the $160 zone. Any more gains might send SOL price toward the $175 resistance zone, above which the price could accelerate higher. The next major resistance sits near the $188 level.
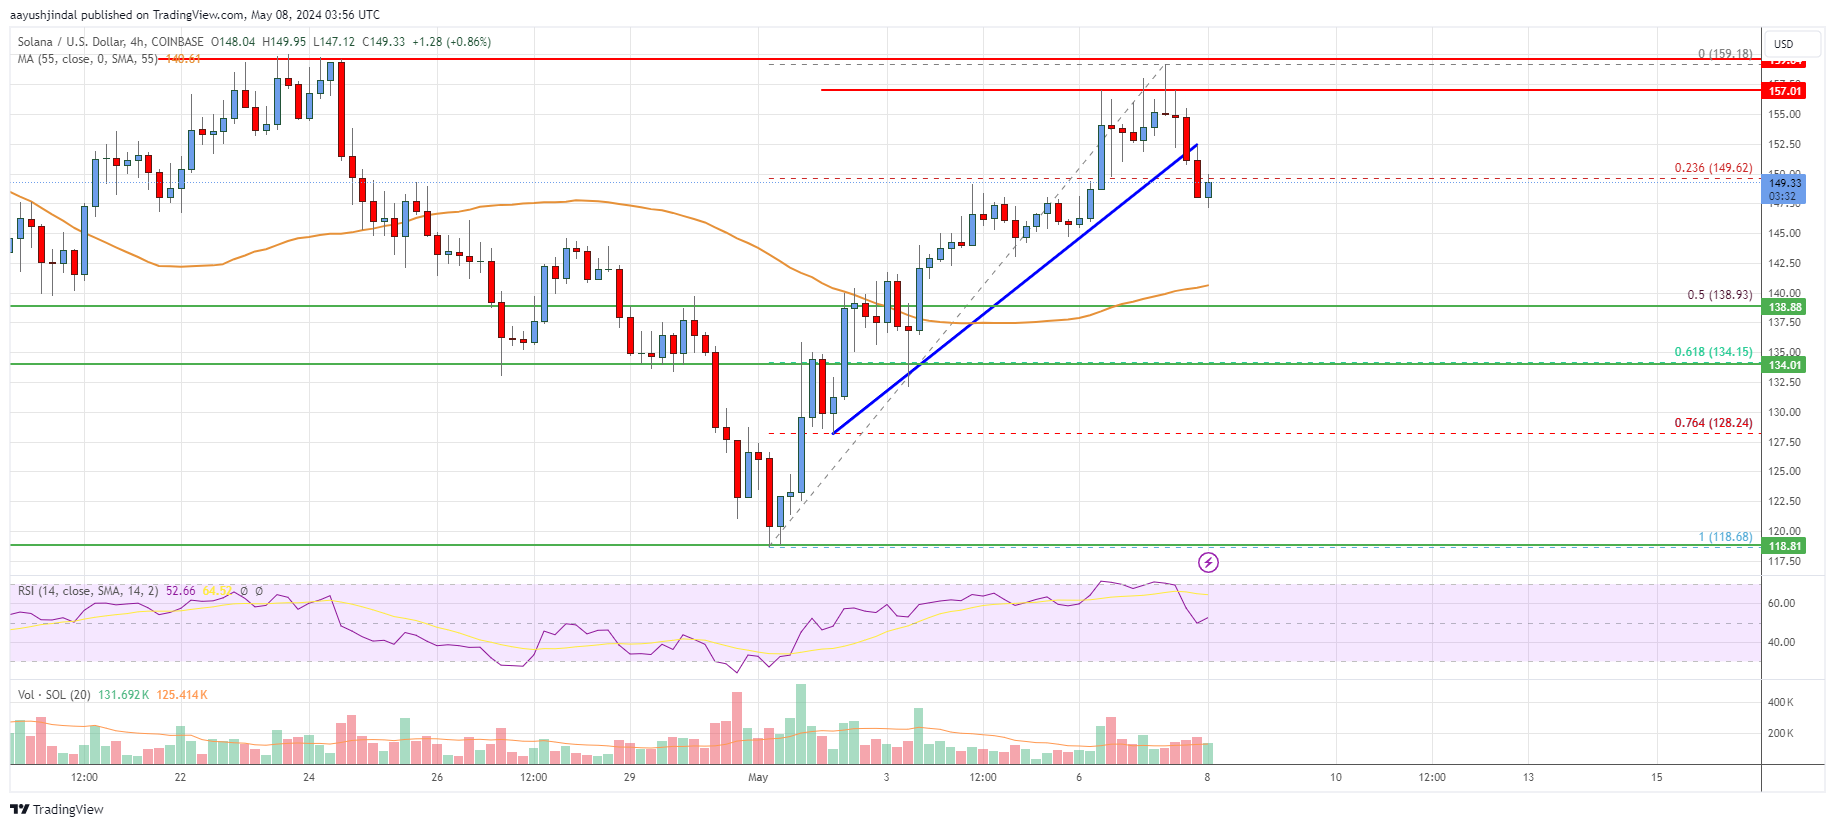
Looking at the chart, Solana price is clearly trading above $140 and the 55 simple moving average (4 hours). Overall, the price must stay above the $138 and $135 support levels to start another increase.
Technical Indicators
4 hours MACD – The MACD is now losing momentum in the bearish zone.
4 hours RSI (Relative Strength Index) – The RSI is now near the 50 level.
Key Support Levels – $138 and $135.
Key Resistance Levels – $155, $160, and $175.