 Dave’s notes:
- The Minnesota Department of Health (MDH) publishes graphics showing the relative risk for testing positive, being hospitalized, or dying of Covid, for the unvaccinated compared to the vaccinated, and for the unvaccinated compared to the boosted. This information in on the Vaccine Breakthrough web page here: https://www.health.state.mn.
us/diseases/coronavirus/stats/ vbt.html. In this post we will examine the second graphic from the top on this web page, Adult Cases, Hospitalizations, and Deaths by Age Group, looking only at Covid deaths data, with relative risk ratios for cases and hospitalizations having been examined previously. - We have recently posted several times on the ramifications of MDH’s continued use of the U.S. Census Bureau 2019 American Community Survey (ACS) 5-Year population estimate for Minnesota, especially for the 65+ age group. The 65+ age group has been increasing by an average of 25,928 people each year, according to the ACS 1-Year population estimates from 2010 through 2021. In addition to using an older population estimate, MDH is using the 2019 5-Year estimate, which is an average of the years 2015 through 2019. Because the 65+ age group population is increasing linearly MDH is effectively using a 2017 65+ population to calculate the 65+ unvaccinated population in 2021 and 2022. Note that MDH calculates the unvaccinated population by starting with the estimated age group population and then subtracting the vaccinated and the boosted populations. Any discrepancy made in the initial population assumption then directly causes the same size discrepancy in the size of the unvaccinated population. By using too small a 65+ population estimate, MDH therefore calculates a smaller 65+ unvaccinated population, which then leads to higher rates of cases, hospital admissions, and deaths per 100k than is found using correct population estimates. In addition to using the ACS 2021 1-Year population as our baseline, we are also extrapolating the 65+ population for 2022 by adding the annual trend of 25,928. Background on the US Census issue can be found here: https://healthy-skeptic.com/
2022/12/02/census-estimate- background/ . We also discuss the impact on the 65+ age group here: https://healthy-skeptic.com/ 2022/12/06/the-real-vax- effectiveness-rates/. - Please note that we are not accusing MDH of intentionally distorting or misrepresenting the data by continuing to use the ACS 2019 5-Year Population Estimate. We have sent repeated emails to MDH as we have investigated this issue, but have yet to receive any acknowledgement or response, despite a record of over 2 years of continual correspondence with them. The effect of prior infection is also not taken into account in this analysis. We have repeatedly requested data matching breakthrough events with prior infections, but MDH has stated such data is unavailable.
- The Adult Cases, Hospitalizations, and Deaths by Age Group graphic on the Vaccine Breakthrough has a pull down menu, allowing us to select between cases, hospitalizations, or deaths. There is also a pull down menu allowing us to select one of four time periods: 1). All 2). Pre-Omicron, which is up to and including 12/12/2021, per correspondence with MDH. 3). Omicron Period, since 12/19/2021, and 4). Last 60 days, which is really the last 9 weeks, per correspondence with MDH. In today’s post we will examine the impact that the use of the 2019 ACS 5-Year population estimate, vs the 2021 ACS 1-Year population estimate for the 18-49 and 50-64 age groups, and the 2022 extrapolated population estimate for the 65+ age group, has on death rates for these four time periods. We will also present a 4 week rolling average charts for the relative risk ratios for each age group.
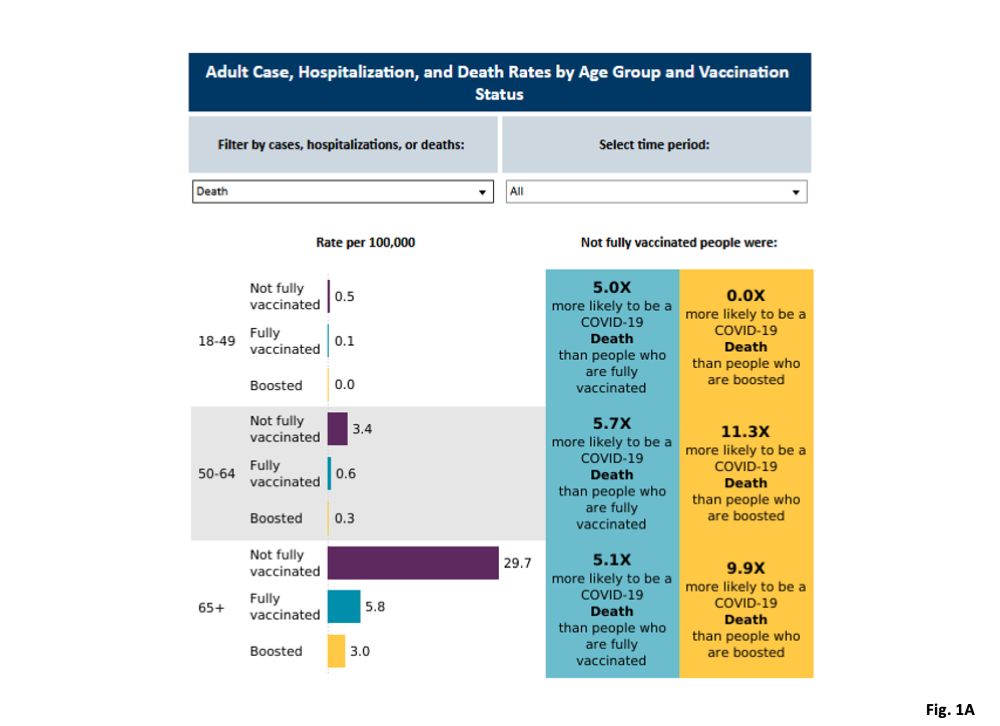
- Fig. 1A, MDH Relative Risk Graphic, for Deaths, for All time period: This graphic was downloaded 12/12/2022, which represents the Covid death rate data as published by MDH on 12/08/2022 using the 2019 ACS 5-Year population estimate. The left side of the graphic presents the number of Covid deaths per 100k for the three adult age groups, when considering all of the breakthrough data available, which is from 5/02/2021 through 11/13/2022. All three vaccination statuses are presented for each age group. Most important to note is that for each age group the unvaccinated category has the highest death rate per 100k over the entire pandemic, while the rates for the vaccinated and boosted are fairly close together for all three age groups. The right side of the graphic presents the relative risk ratios of the unvaccinated to the vaccinated, and the unvaccinated to the boosted. The risk ratios are calculated by taking the ratio of the death rates per 100k shown on the left side of the graphic.
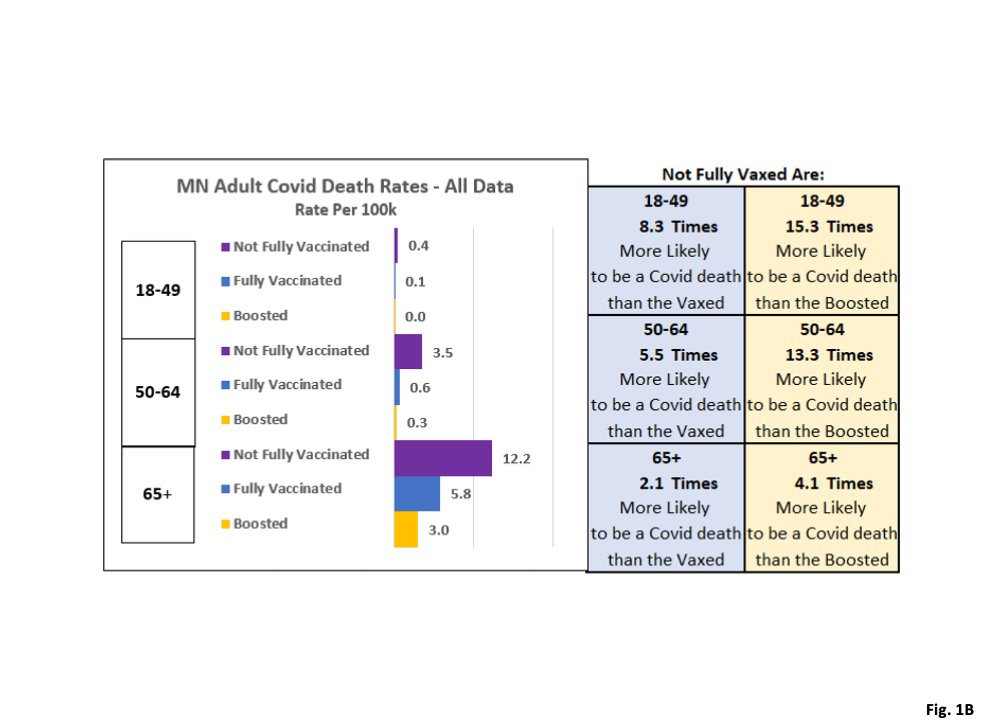
- Fig. 1B, Replicated Relative Risk Graphic for Deaths, for All time period, using 2021 ACS 1-Year population estimate and 2022 extrapolation for 65+ age group: In this graphic we replicate MDH’s graphic, but recalculating all the rates and risk ratios using the 2019 ACS 1-Year population estimate for the 18-49 and 50-64 age groups, and the 2022 extrapolated population estimate for the 65+ age group. Note that on the left side we calculate identical death rates per 100k for the vaccinated and boosted categories of each age group, compared to the MDH graphic in Fig. 1A. We calculate slightly lower death rates per 100k for the unvaccinated 18-49 age group, slightly higher death rates for the unvaccinated 50-64 age group, and greatly lower death rates for the unvaccinated 65+ age group. These changes in unvaccinated death rates are driven solely by MDH’s use on the 2019 ACS 5-Year population estimate, vs the 2021 ACS 1-Year and 2022 extrapolated population. When we look at the risk ratios on the right side of the graphic, the biggest changes are for the 65+ age group. We calculate that the unvaccinated 65+ age group is 2.1 times more likely to be a Covid death than the vaccinated, compared to MDH’s ratio of 5.1 times. We calculated that the 65+ unvaccinated age group are 4.1 times more likely to be a Covid death than the boosted, compared to MDH’s ratio of 9.9 times. Note that we calculate a relative risk ratio for the 18-49 unvaccinated to boosted of 15.3, while MDH reports a risk ratio of 0.0 in Fig. 1A. In replicating MDH’s calculations we find that they should have reported a risk ratio of 16.0 for the 18-49 unvaccinated to boosted.
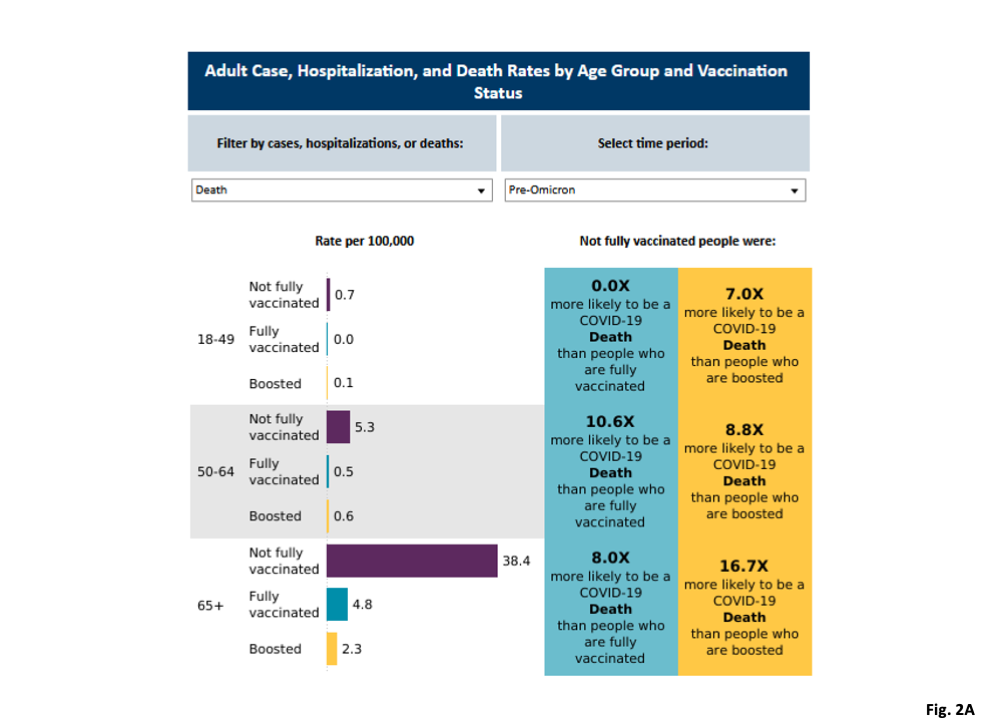
- Fig. 2A, MDH Relative Risk Graphic, for Deaths, for Pre-Omicron time period: This is MDH’s graphic for the death rates for the Pre-Omicron time period, as downloaded on 12/12/2022. In our replication of MDH’s calculations, we find that MDH should have reported risks ratios for the 18-49 age group for the unvaccinated to the vaccinated of 15.2, not 0.0, and for the unvaccinated to the boosted of 11.7 not 7.0. Similarly, for the 50-64 age group, MDH should have reported a risk ratio of 9.6, not 10.6. Finally, for the 65+ age group, MDH should have reported a risk ratio of 17.0, not 16.7, for the unvaccinated to boosted ratio. For cases and hospitalizations our calculated risk ratios using MDH’s population estimate replicated MDH’s risk ratios perfectly, so we believe that our analysis is correct for deaths as well, and that MDH has a glitch in their reporting system for death risk ratios.
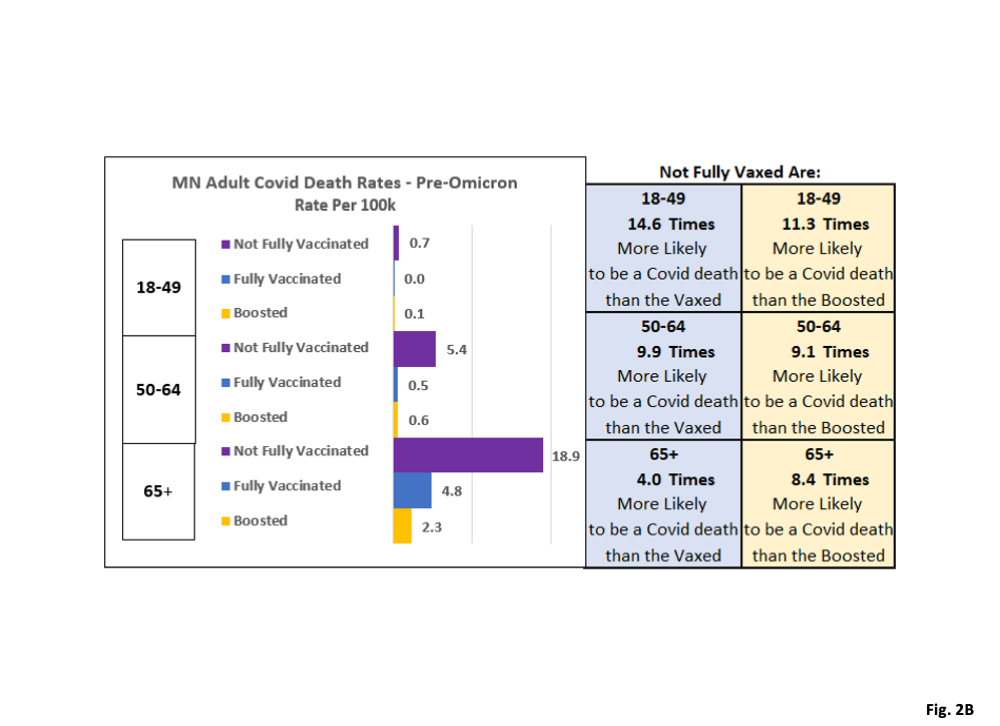
- Fig. 2B, Replicated Relative Risk Graphic for Death, for Per-Omicron time period, using 2021 ACS 1-Year population estimate and 2022 extrapolation for 65+ age group: The same pattern of impacts for using the 2021 ACS 1-Year population estimate as seen in Fig. 1B can be seen here. The biggest changes are for the 65+ unvaccinated age group, which has its death rate per 100k cut approximately in half. This then causes the risk ratios for the 65+ age group to also be cut approximately in half, compared to Fig. 2A.
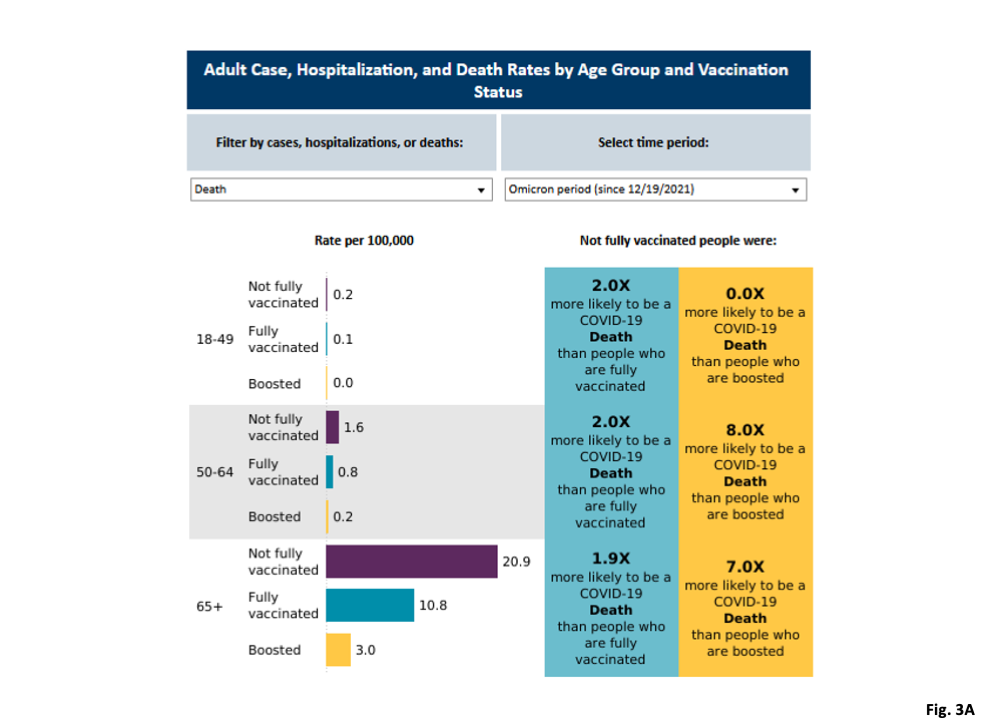
- Fig. 3A, MDH Relative Risk Graphic, for Deaths, Omicron time period, since 12/19/2021: This is MDH’s graphic for the death rates for the Omicron time period, as downloaded on 12/12/2022. As we noted for the other time periods in Fig. 1A and 2A, MDH’s reported risk ratios have some errors. For the 18-49 age group, the ratio for the unvaccinated to the vaccinated should be 3.5, not 2.0, and for the unvaccinated to the boosted should be 7.5, not 0.0, as reported by MDH. For the 50-64 age group, the reported risk ratio for the unvaccinated to the boosted should be 6.7, not 8.0 as reported by MDH.
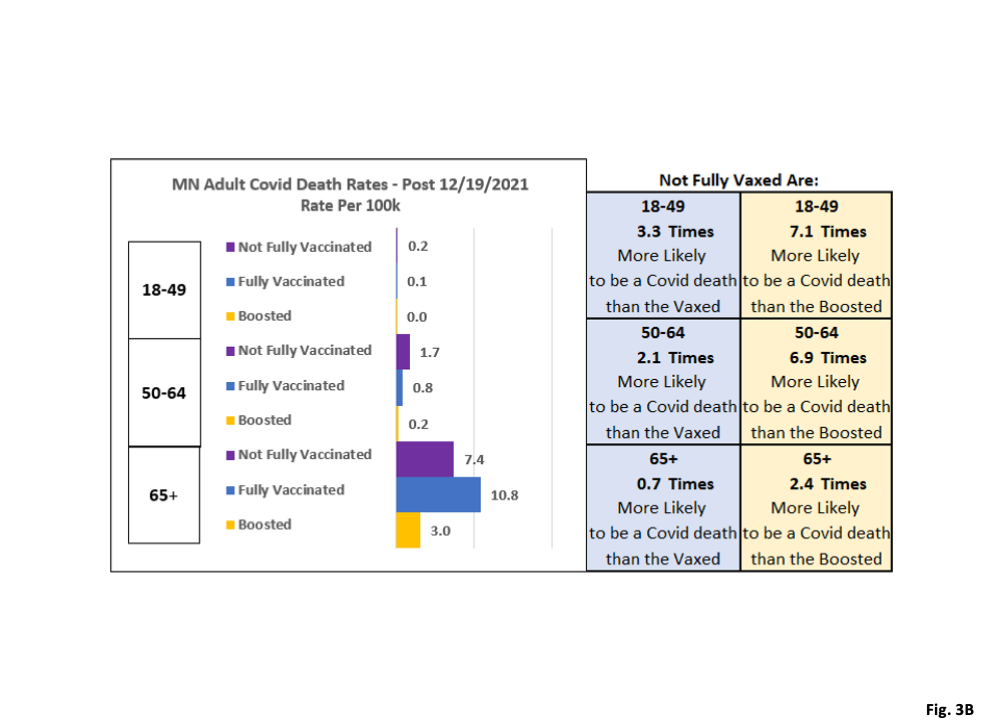
- Fig. 3B, Replicated Relative Risk Graphic for Deaths, for Omicron time period, using 2021 ACS 1-Year population estimate and 2022 extrapolation for 65+ age group: The same pattern of impacts using the 2021 ACS 1-Year population estimate as seen in Fig. 1B can be seen here. However, when looking at this time period, the relative risk for the unvaccinated 65+ age group compared to the vaccinated is reduced by a factor of nearly three, from 1.9 times more likely to be a Covid death to 0.7 times (therefore less likely to be a Covid death than the vaccinated). Similarly, the relative risk for the unvaccinated 65+ age group compared to the boosted, is also reduced by a factor of nearly three, from 7.0 times more likely to be a Covid death down to 2.4 times more likely to be a Covid death. Our calculations have a greater reduction in risk for 2022 because we are adding in another assumed population growth of 25,928. In addition, as more people got vaccinated in 2022, the unvaccinated 65+ people used by MDH in its calculations got even smaller, meaning that the extra population added by using the 2021 ACS 1-Year population estimate extrapolated to 2022 made a greater proportional difference than in 2021.
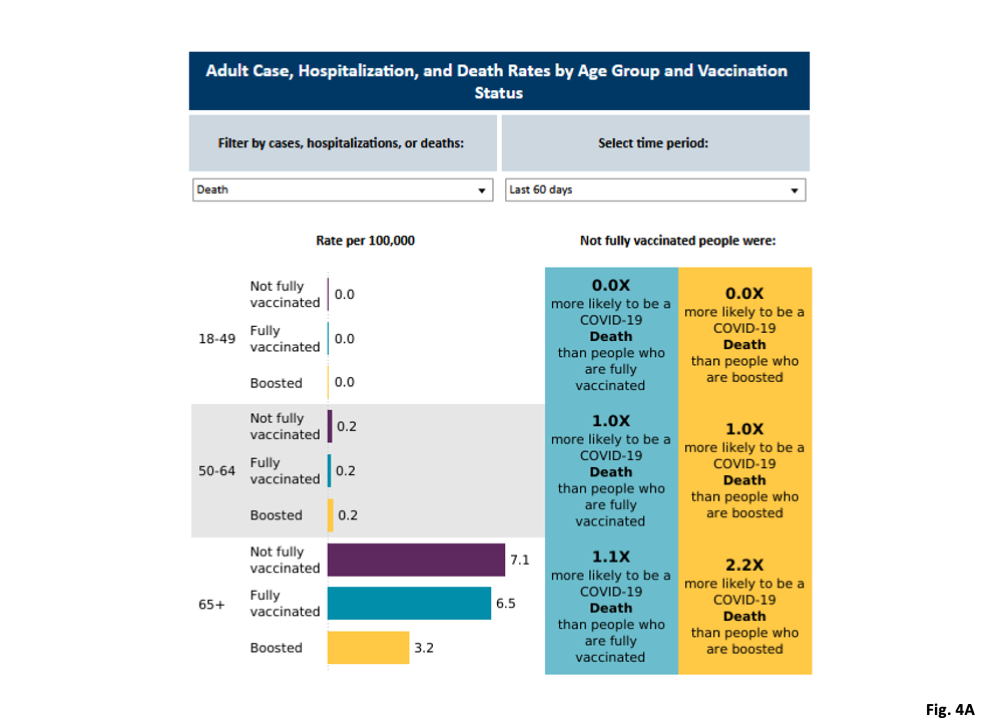
- Fig. 4A, MDH Relative Risk Graphic, for Deaths, Last 60 days’ time period: This is MDH’s graphic for the death rates for the 60 days (really the last 9 weeks of data per MDH communication), as downloaded on 12/12/2022. As we note for other time periods, the risk ratios reported by MDH are incorrect. The correct risk ratios for the 18-49 age group should be 1.5 for the unvaccinated compared to the vaccinated, not 0.0, and also should be 3.8 for the unvaccinated to the boosted, not 0.0. The risk ratios for the 50-64 age group should both be 0.8, not 1.0 as reported by MDH.
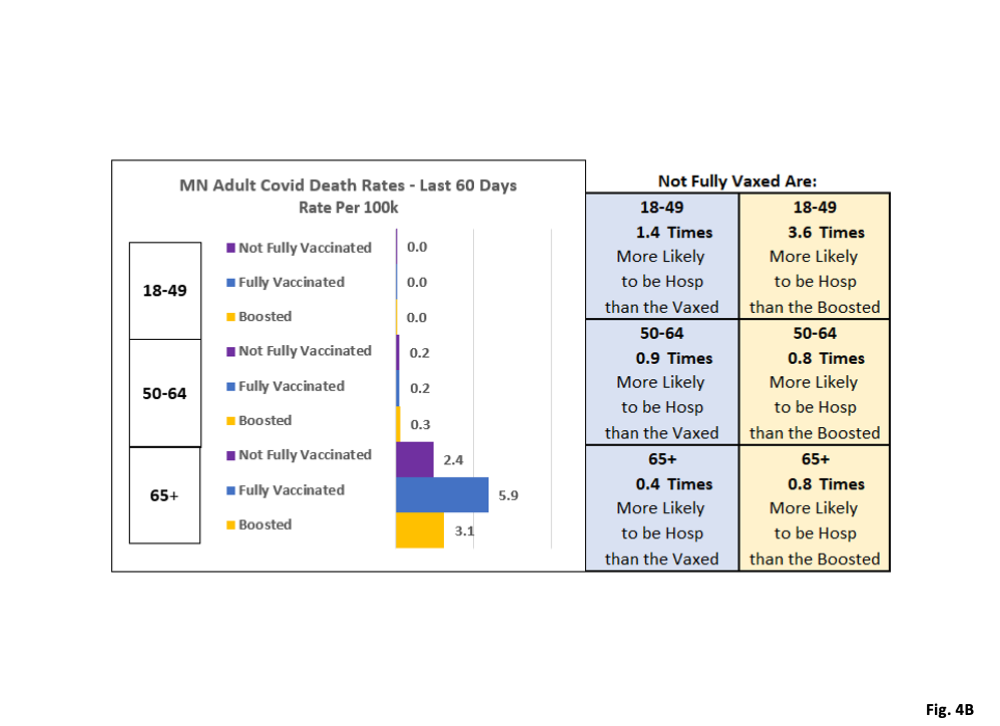
- Fig. 4B, Replicated Relative Risk Graphic for Deaths, Last 60 days’ time period, using 2021 ACS 1-Year population estimate and 2022 extrapolation for 65+ age group: We see again that the 18-49 and 50-64 age group rates and relative risks are very minimally affected by the change in population baseline, at least when considering the risk ratios that MDH should have reported as noted above. As before the 65+ unvaccinated death rates are massively affected, as well of the relative risk ratios. The unvaccinated 65+ age group is only 0.4 times as likely to be a Covid death as the vaccinated, compared to 1.1 times as reported by MDH in Fig. 4A. The unvaccinated 65+ age group is only 0.8 times as likely to be a Covid death as the boosted, compared to 2.2 times as reported by MDH in Fig. 4A.
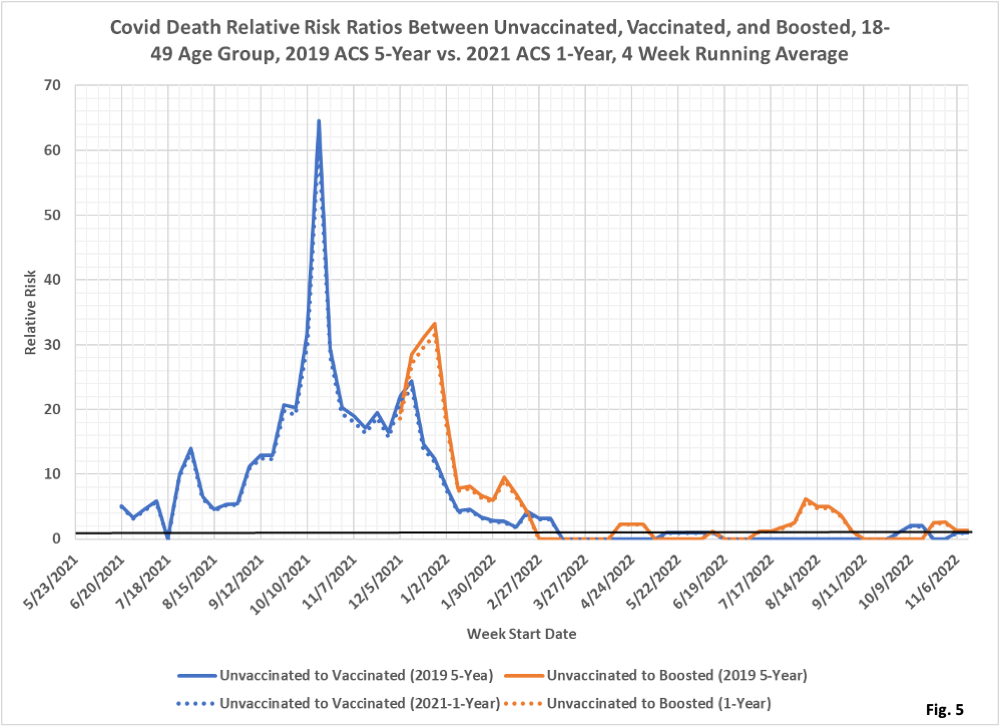
- Fig. 5: Covid Deaths Relative Risk Ratios, 18-49 Age Group: This is a new graph we have developed, presenting the relative risk ratios for Covid deaths of the unvaccinated to the vaccinated, and of the unvaccinated to the boosted, for the 18-49 age group. These ratios are calculated as 4 week rolling averages. We display the results using MDH’s 2019 ACS 5-Year population baseline as solid curves, and using the 2021 ACS 1-Year population estimate as dotted curves. The impact on the risk ratios of the change to the 2021 ACS 1-Year population estimate is minimal. There are quite large risk ratios in the early time period for both the unvaccinated to vaccinated, and unvaccinated to boosted, is striking along with the rapid decline to very low levels in early 2022.
- We have highlighted the horizontal line at a Relative Risk Ratio of 1. At a ratio of one the unvaccinated and vaccinated, or vaccinated and boosted, have identical death rates and therefore vaccination or boosting provides no measurable benefit. At Relative Risk Ratios less than one the unvaccinated have lower death rates than the vaccinated or boosted. Since January 2022 the Relative Risk Ratios are close to 1, so we would conclude that vaccination or boosting provides only minimal benefit for this age group for deaths since January 2022.
- Note that there was a period of time last August and September where the risk ratio for the unvaccinated to the boosted rose above 1.0, to roughly 6. During this time period there were extremely few Covid deaths in the 18-49 age group, and the this rise in risk ratio is just the result of taking ratios of very small numbers, where a categorization of even one death as Covid can impact the risk ratio.
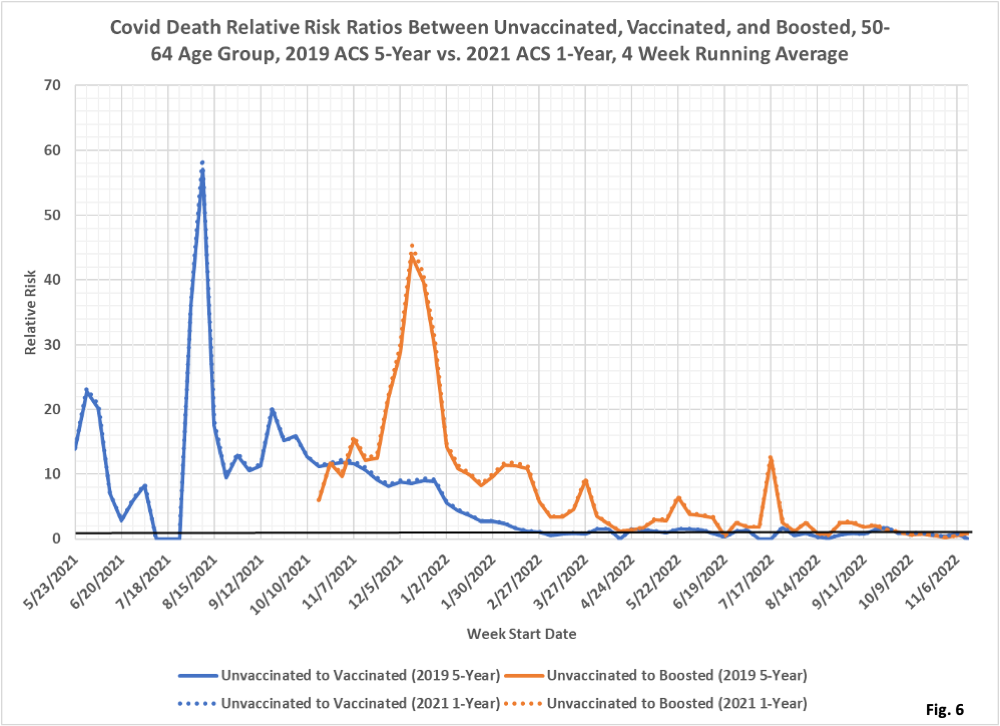
- Fig. 6: Covid Deaths Relative Risk Ratios, 50-64 Age Group: This graph presents the relative risk ratios of the unvaccinated to the vaccinated, and of the unvaccinated to the boosted for the 50-64 age group. These ratios are calculated as 4 week rolling averages. We display the results using MDH’s 2019 ACS 5-Year population baseline as solid curves, and using the 2021 ACS 1-Year population estimate as dotted curves. The impact on the risk ratios of the change to the 2021 ACS 1-Year population estimate is minimal, but increases the relative risk ratios slightly. The risk ratio of the unvaccinated to the boosted stays somewhat elevated until relatively recently, falling to 1 around April 2022 and then bouncing above 1 since then.
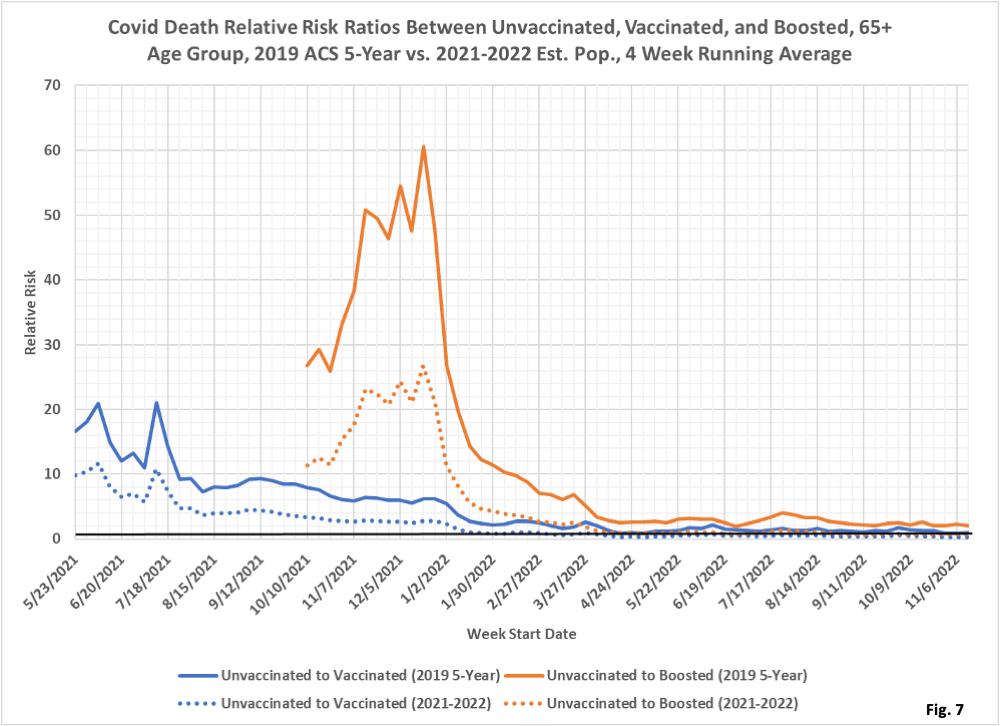
- Fig. 7: Covid Deaths Relative Risk Ratios, 65+ Age Group: This graph presents the Relative Risk Ratios of the unvaccinated to the vaccinated, and of the unvaccinated to the boosted for the 65+ age group. These ratios are calculated as 4 week rolling averages. We display the results using MDH’s 2019 ACS 5-Year population baseline as solid curves, and using the 2021 ACS 1-Year population estimate (and 2022 Relative Risk Ratios calculated using the extrapolated 2022 population estimate) as dotted curves. The impact on the risk ratios of the change to the 2021 ACS 1-Year population estimate is very large, reducing the relative risk ratios by a factor or 2 to 3 from the 2019 ACS 5-Year population as used by MDH. Similar to the other age groups, the relative risk ratios for both the unvaccinated to vaccinated, and the unvaccinated to boosted, start out very high with a rapid decline to very low levels in early 2022. The underlying case rates for this group in Fig. 3 here https://healthy-skeptic.com/
2022/12/06/the-real-vax- effectiveness-rates/, shows that the vaccinated and the boosted really did have death rates per 100k greatly lower than for the unvaccinated in much of 2021, although the unvaccinated fared better than MDH calculates. Since March 2022 the relative risk ratios are hovering around 1 (considering the 2021-2022 population estimate shown by the dotted curves), meaning that vaccination or boosting did not provide any meaningful reduction in deaths per 100k.
 The Healthy Skeptic is a website about the health care system, and is written by Kevin Roche, who has many years of experience working in the health industry. Mr. Roche is available to assist health care companies through consulting arrangements through Roche Consulting, LLC and may be reached at
  RSS - Posts