Markets
The Monthly Cost of Buying vs. Renting a House in America
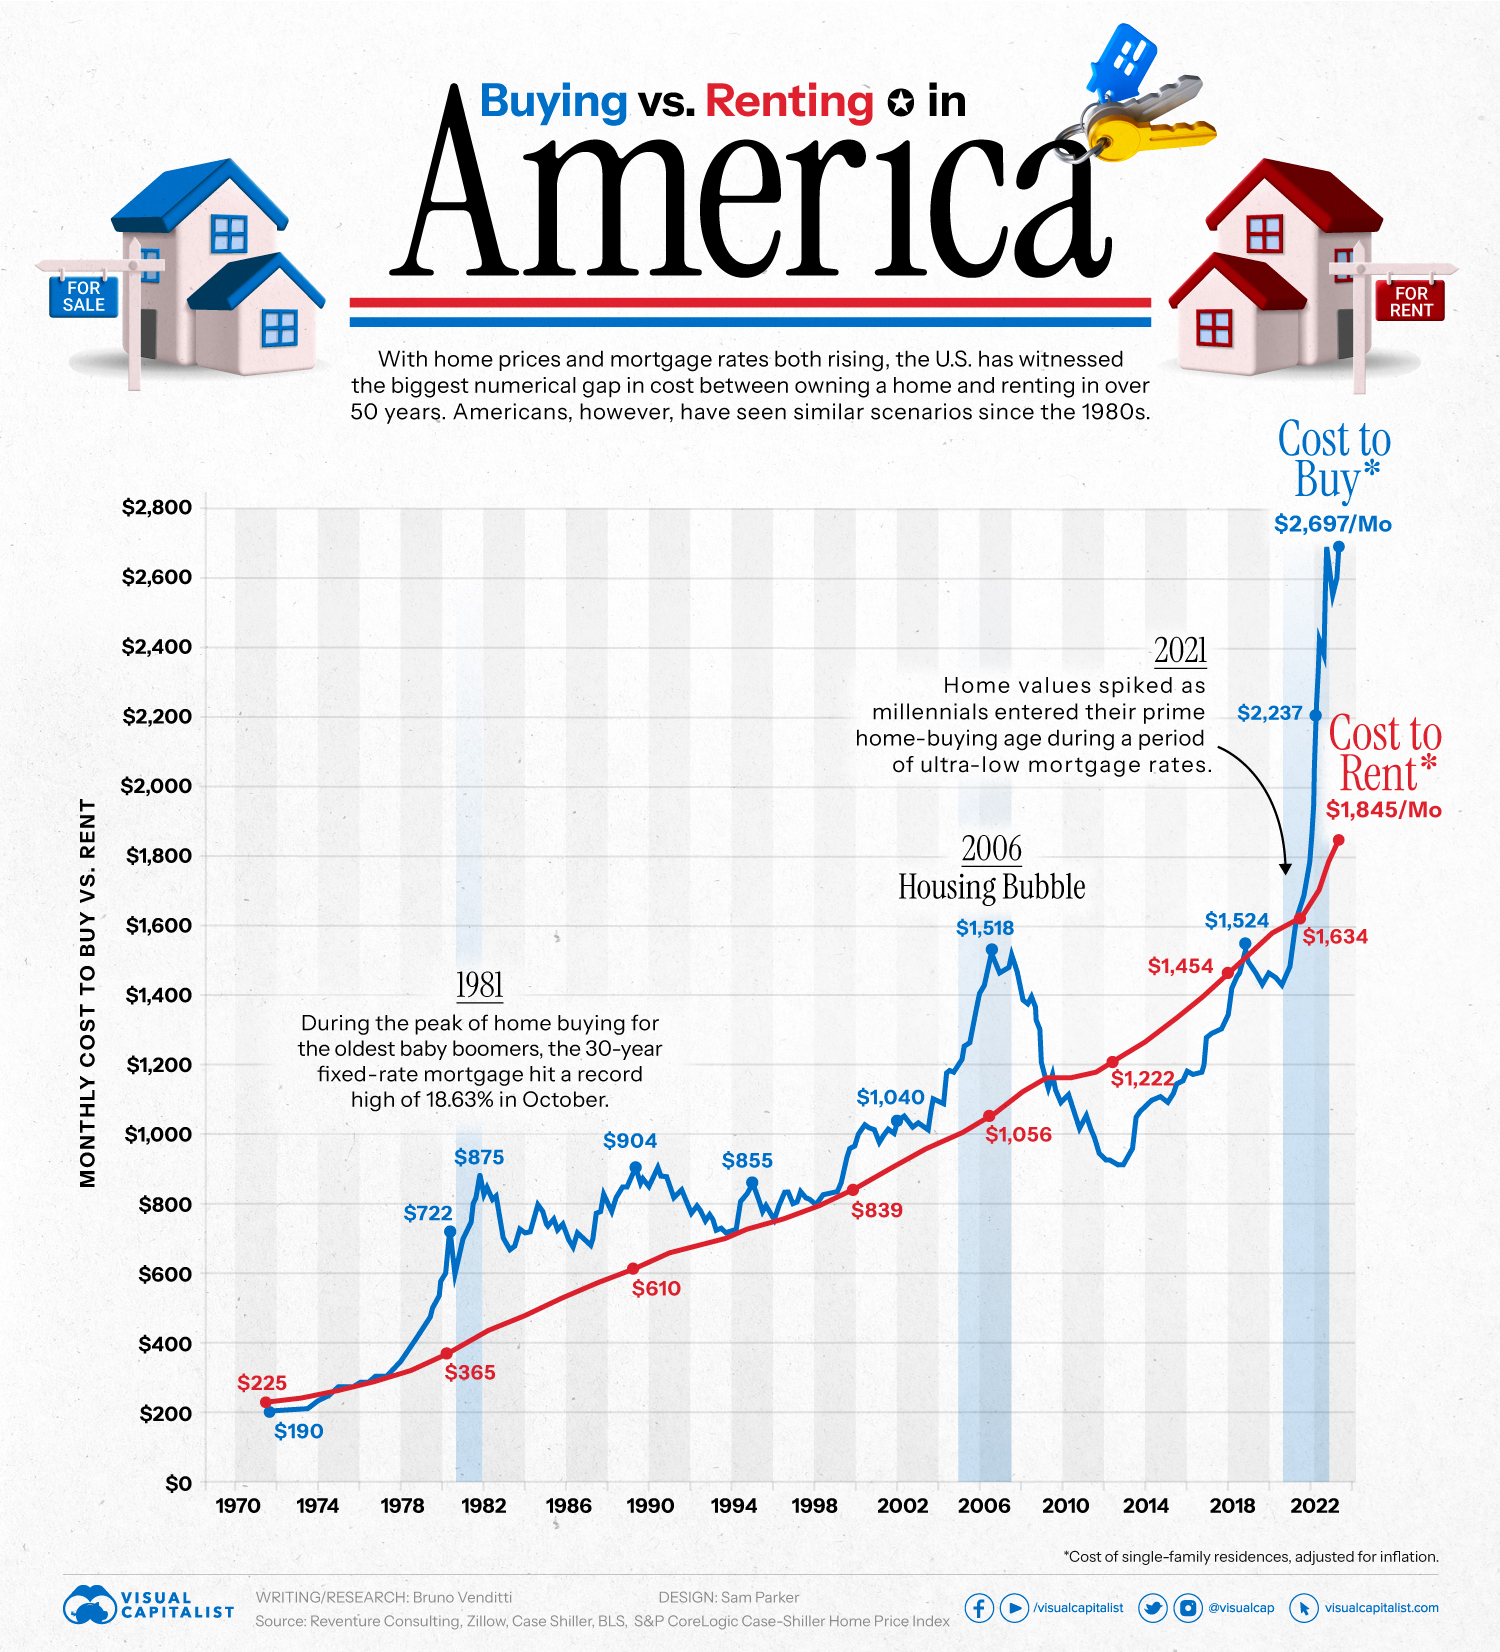
The Monthly Cost of Buying vs. Renting a House in America
With home prices and mortgage rates both rising, the U.S. is now witnessing the biggest numerical gap in the monthly cost between owning a home and renting in over 50 years.
Americans, however, have seen similar scenarios occur since the early 1980s.
Today’s chart uses data from Reventure Consulting to highlight the cost of buying vs. renting a single-family residence in the U.S. since 1970, adjusted for inflation.
Mortgage Rates Jump to New High
In August 2023, mortgage rates rose to the highest level in 23 years, with the national average 30-year fixed mortgage hitting 7.48%.
As a result, the median rent in America is approximately $1,850 per month, about 30% cheaper than the median cost to buy, standing at $2,700 per month. This gap represents the largest difference between renting and buying in U.S. history.
While the difference was less than $200 in 2022, in 2023 the gap surpassed $800.
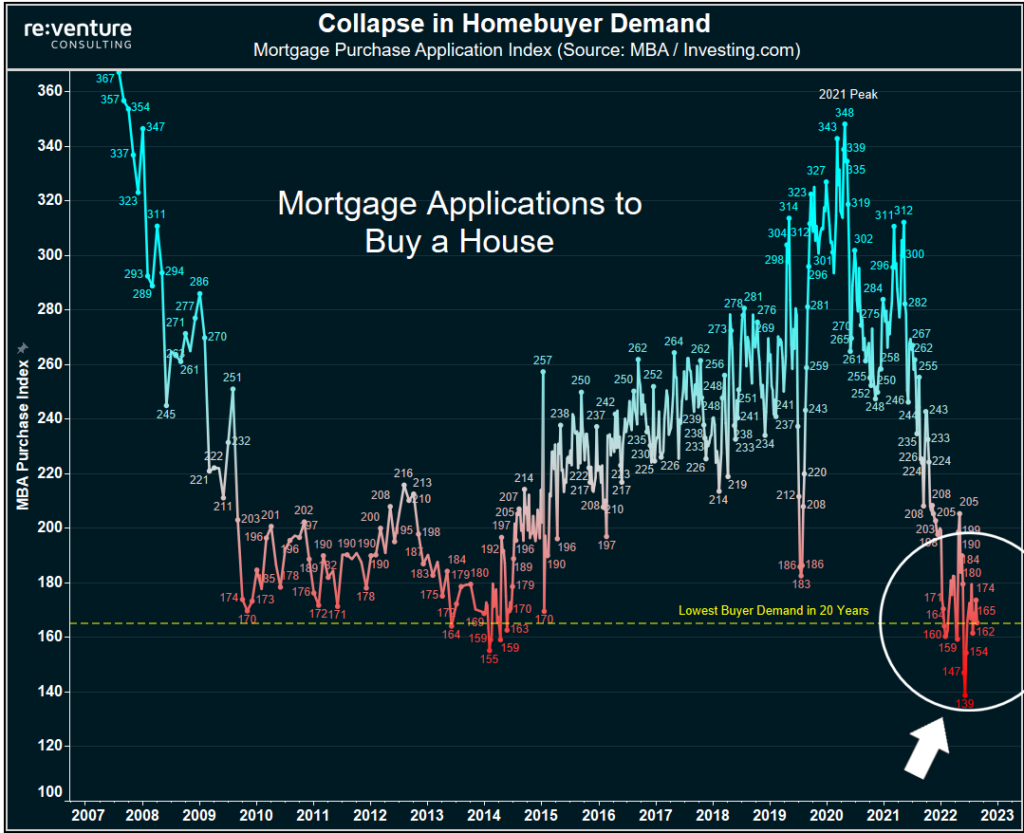
Many buyers, particularly those seeking their initial home purchase, have now been priced out of the market with concerns that they cannot afford home ownership. As a result, mortgage applications for home purchases have hit their lowest point in 20 years:
Rent costs have also seen an uptick, but not at the same pace, as the market adjusted following a steep rent spike witnessed during the pandemic.
Will Mortgage Rates Drop in 2023?
Increases in interest rates affect long-term home loans, such as 30-year fixed-rate mortgages. And starting in 2022, the Federal Reserve began to hike rates from their near-zero level to the current range of 5.25-5.5%.
Recently, the Federal Reserve unveiled new projections, indicating that the interest rate could potentially reach 5.6% by the end of 2023, implying at least one more rate hike in 2023.
As a result, numerous experts are anticipating that mortgage rates will likely remain above 6% for the rest of this year.


Markets
Visualizing Berkshire Hathaway’s Stock Portfolio (Q1 2024)
We visualized the latest data on Berkshire Hathaway’s portfolio to see what Warren Buffett is invested in.
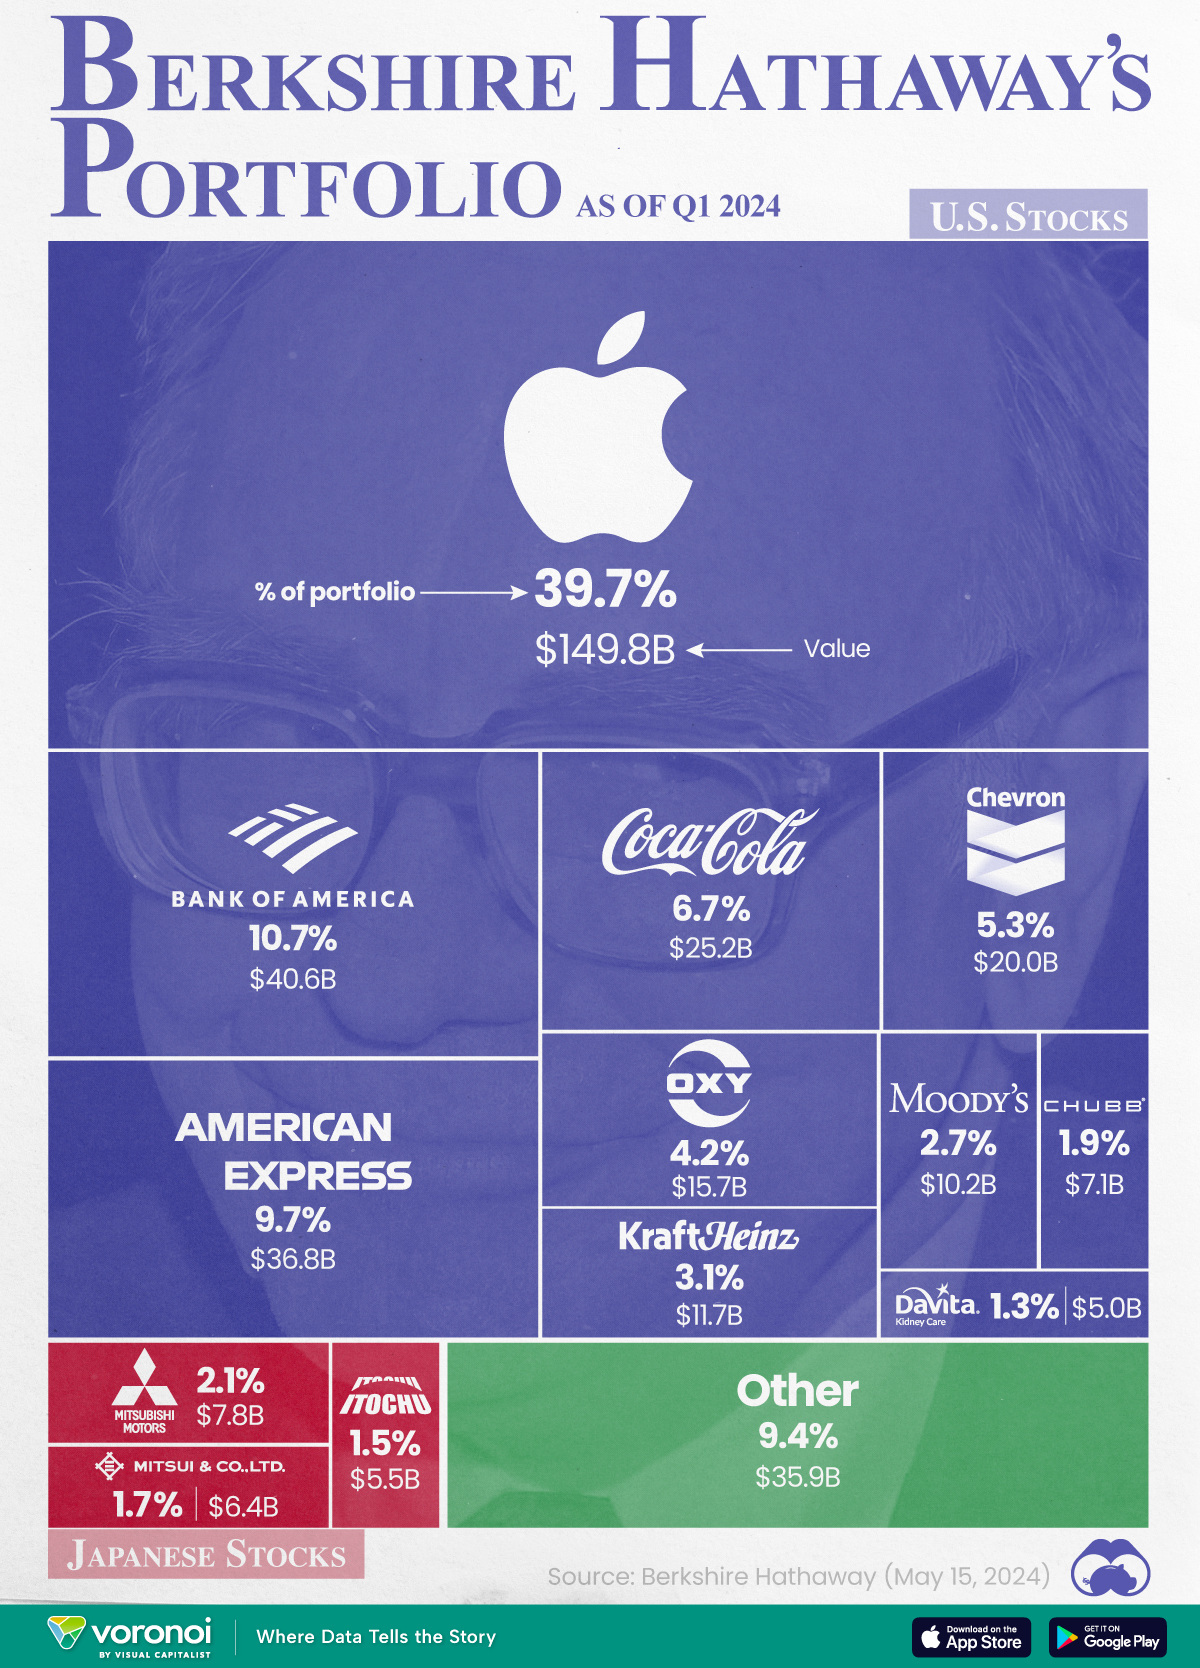
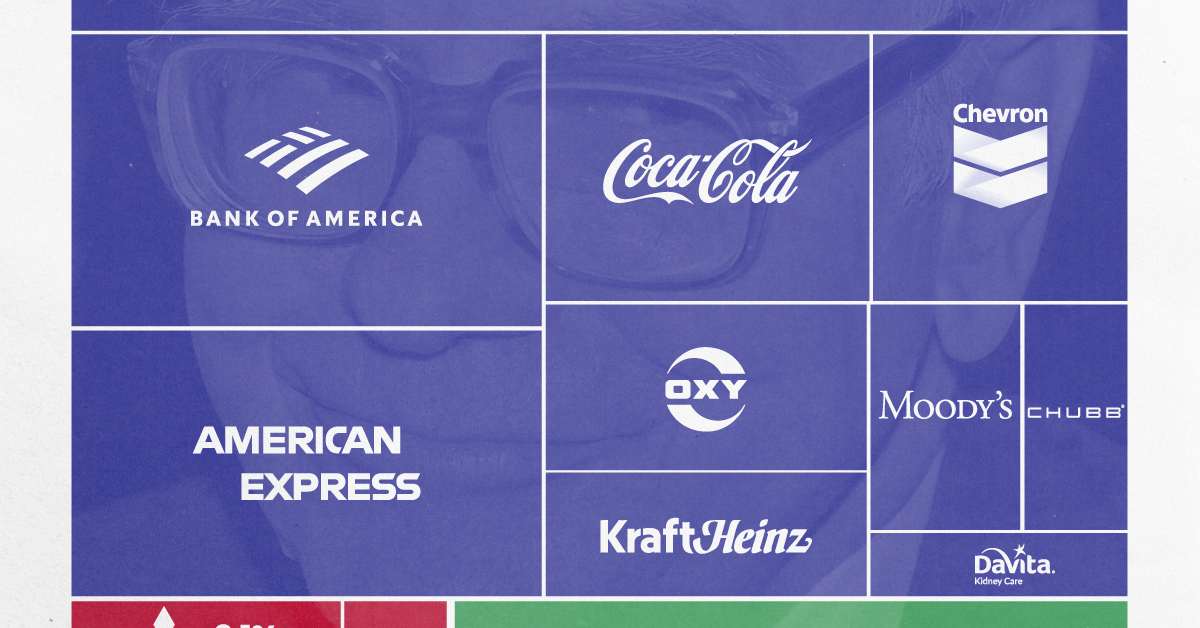
Visualizing Berkshire Hathaway’s Portfolio as of Q1 2024
This was originally posted on our Voronoi app. Download the app for free on iOS or Android and discover incredible data-driven charts from a variety of trusted sources.
Wondering what the Oracle of Omaha has his money invested in?
In this graphic, we illustrate Berkshire Hathaway’s portfolio holdings, as of Q1 2024. This data was released on May 15, 2024, and can be easily accessed via CNBC’s Berkshire Hathaway Portfolio Tracker.
The value of each position listed in this graphic is based on market prices as of May 23, 2024, and will change over time.
Furthermore, note that Berkshire has received SEC permission to temporarily withhold data on certain positions. This includes all of its Japanese stocks, which are reported as of June 12, 2023.
It’s (almost) all Apple
The data we used to create this graphic can be found in the following table. Positions worth less than $5 billion were included in “Other”.
| Company | % of Portfolio | Value (As of 05-23-2024) |
|---|---|---|
| 🇺🇸 Apple Inc | 39.7 | $149.8B |
| 🇺🇸 Bank of America | 10.7 | $40.6B |
| 🇺🇸 American Express | 9.7 | $36.8B |
| 🇺🇸 Coca-Cola | 6.7 | $25.2B |
| 🇺🇸 Chevron | 5.3 | $20.0B |
| 🇺🇸 Occidental Petroleum | 4.2 | $15.7B |
| 🇺🇸 Kraft Heinz | 3.1 | $11.7B |
| 🇺🇸 Moody’s | 2.7 | $10.2B |
| 🇯🇵 Mitsubishi Corp | 2.1 | $7.8B |
| 🇺🇸 Chubb | 1.9 | $7.1B |
| 🇯🇵 Mitsui & Co | 1.7 | $6.4B |
| 🇯🇵 Itochu Corporation | 1.5 | $5.5B |
| 🇺🇸 DaVita | 1.3 | $5.0B |
| 🌍 Other | 9.4 | $35.9B |
| Total | 100 | $377.9B |
From this, we can see that Berkshire’s largest position is Apple, which makes up almost 40% of the portfolio and is worth nearly $150 billion.
While Warren Buffett once referred to Apple as the best business in the world, his firm actually trimmed its position by 13% in Q1 2024.
Even after that cut, Berkshire still maintains a 5.1% ownership stake in Apple.
Why Japanese Stocks?
While most of Berkshire’s major positions are in American companies, Japanese firms make up a significant chunk.
In 2020, Berkshire took positions in five Japanese trading houses: Itochu, Marubeni, Mitsubishi, Mitsui, and Sumitomo.
Also known as sōgō shōsha, which translates to “general trading company”, these firms are highly diversified across major industries.
According to an article from IMD, Buffett sees an attractive opportunity in Japan due to the country’s low-interest rates, among other things.
Learn More About Investing From Visual Capitalist
If you enjoyed this graphic, be sure to check out Visualizing the Growth of $100, by Asset Class (1970-2023).

-

 Politics2 weeks ago
Which Countries Have the Most Economic Influence in Southeast Asia?
-

 Culture2 weeks ago
How Popular Snack Brand Logos Have Changed
-

 Misc2 weeks ago
Visualized: Aircraft Carriers by Country
-

 Cannabis2 weeks ago
Mapped: Countries Where Recreational Cannabis is Legal
-

 Business2 weeks ago
Charted: How the Logos of Select Fashion Brands Have Evolved
-

 Maps2 weeks ago
Mapped: U.S. States By Number of Cities Over 250,000 Residents
-

 Misc2 weeks ago
Visualizing Global Losses from Financial Scams
-
 Mining2 weeks ago
The Biggest Salt Producing Countries in 2023