Energy
Which Countries Produce the Most Natural Gas?
![]() Subscribe to the Elements free mailing list for more like this
Subscribe to the Elements free mailing list for more like this


Which Countries Produce the Most Natural Gas?
This was originally posted on Elements. Sign up to the free mailing list to get beautiful visualizations on natural resource megatrends in your email every week.
Natural gas prices have risen since Russia’s invasion of Ukraine, exacerbating an already tight supply situation.
Making matters worse, Moscow has since cut gas exports to Europe to multi-year lows, sending Europe’s gas price to almost 10 times its pre-war average.
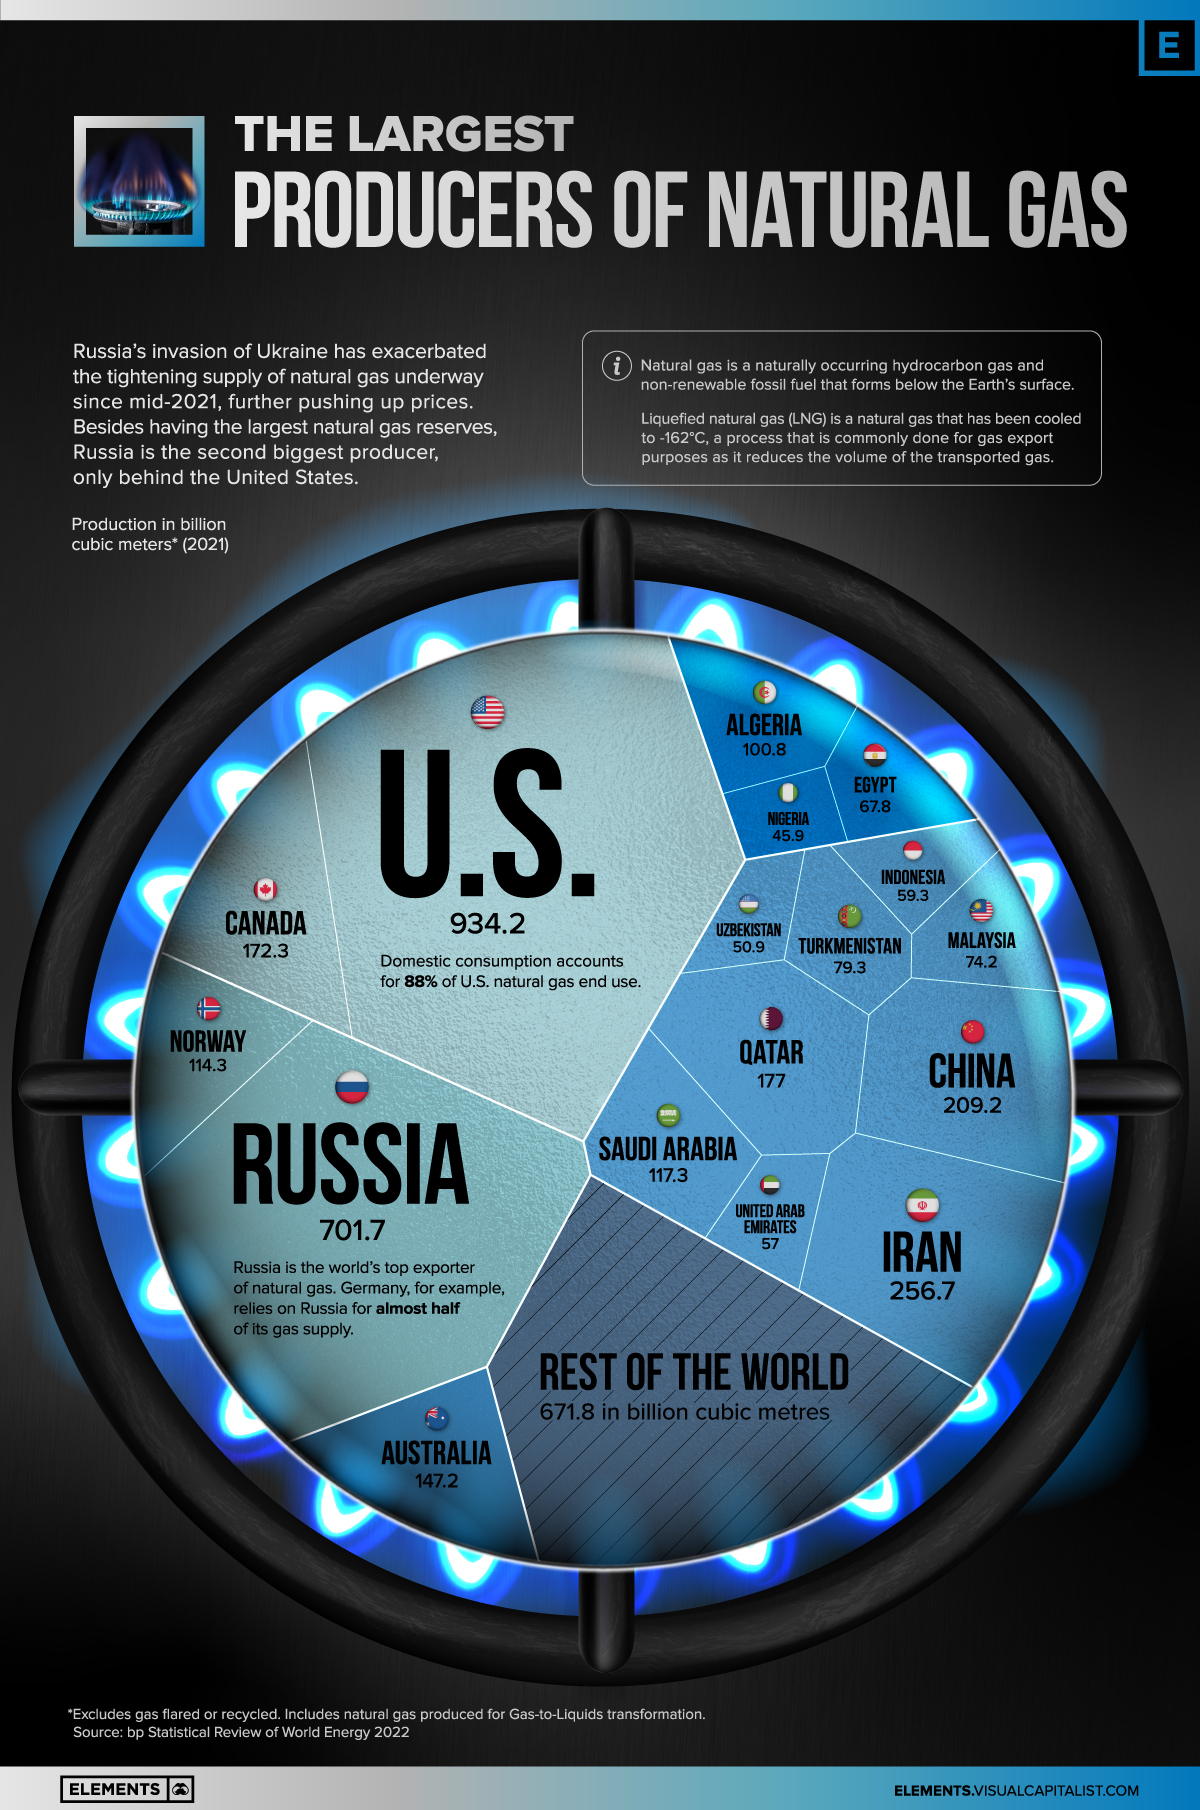
Using data from BP’s Statistical Review of World Energy, the above infographic provides further context on the gas market by visualizing the world’s largest gas producers in 2021.
Natural Gas Consumption at All-Time High in 2021
Natural gas is part of nearly every aspect of our daily lives. It is used for heating, cooking, electricity generation, as fuel for motor vehicles, in fertilizers, and in the manufacture of plastics.
The fuel is a naturally occurring hydrocarbon gas and non-renewable fossil fuel that forms below the Earth’s surface. Although the Earth has enormous quantities of natural gas, much of it is in areas far from where the fuel is needed. To facilitate transport and reduce volume, natural gas is frequently converted into liquefied natural gas (LNG), in a process called liquefaction.
Despite global efforts to reduce reliance on fossil fuels, natural gas consumption reached a new all-time high in 2021, surpassing the previous record set in 2019 by 3.3%.
Demand is expected to decline slightly in 2022 and remain subdued up to 2025, according to the International Energy Agency.
| Region | 2021 Demand in Billion Cubic Meters (bcm) | 2022P (bcm) | 2025P (bcm) |
|---|---|---|---|
| Africa | 169 | 172 | 188 |
| Asia Pacific | 895 | 907 | 990 |
| Central and South America | 153 | 147 | 153 |
| Eurasia | 634 | 619 | 632 |
| Europe | 604 | 549 | 536 |
| Middle East | 564 | 582 | 627 |
| North America | 1,084 | 1,108 | 1,116 |
| World | 4,103 | 4,083 | 4,243 |
The Asia Pacific region and the industrial sector are expected to be the main drivers of global gas consumption in the coming years
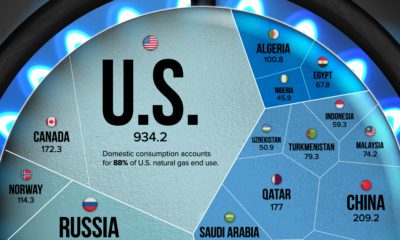
Natural Gas Production, by Country
The world’s top 10 producers of natural gas account for about 73% of total production.
| Rank | Country | 2021 Production (bcm) | Share % |
|---|---|---|---|
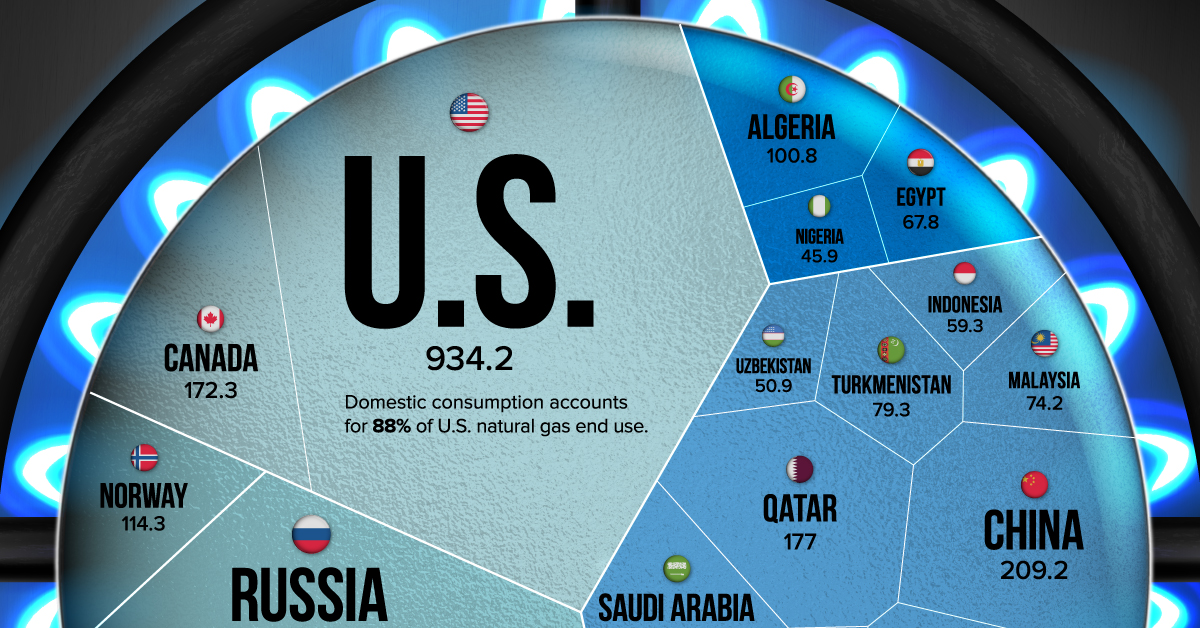
| #1 | 🇺🇸 United States | 934.2 | 23.1% |
| #2 | 🇷🇺 Russia | 701.7 | 17.4% |
| #3 | 🇮🇷 Iran | 256.7 | 6.4% |
| #4 | 🇨🇳 China | 209.2 | 5.2% |
| #5 | 🇶🇦 Qatar | 177.0 | 4.4% |
| #6 | 🇨🇦 Canada | 172.3 | 4.3% |
| #7 | 🇦🇺 Australia | 147.2 | 3.6% |
| #8 | 🇸🇦 Saudi Arabia | 117.3 | 2.9% |
| #9 | 🇳🇴 Norway | 114.3 | 2.8% |
| #10 | 🇩🇿 Algeria | 100.8 | 2.5% |
| #12 | 🇹🇲 Turkmenistan | 79.3 | 2.0% |
| #13 | 🇲🇾 Malaysia | 74.2 | 1.8% |
| #14 | 🇪🇬 Egypt | 67.8 | 1.7% |
| #15 | 🇮🇩 Indonesia | 59.3 | 1.5% |
| #16 | 🇦🇪 United Arab Emirates | 57.0 | 1.4% |
| #17 | 🇺🇿 Uzbekistan | 50.9 | 1.3% |
| #18 | 🇳🇬 Nigeria | 45.9 | 1.1% |
| 🌐 Rest of the World | 671.8 | 16.6% | |
| 🌐 Global Total | 4,036.9 | 100.0% |
Natural gas accounts for 32% of primary energy consumption in the United States, the world’s largest producer. Russia is the second biggest producer, and also has at least 37 trillion cubic meters of natural gas reserves, the most in the world.
China’s natural gas production grew by 7.8% in 2021, and it has nearly doubled since 2011. This sustained growth in production is partly down to government policies incentivizing coal-to-gas switching.
Europe’s Natural Gas Crisis
Russia has significantly reduced flows of natural gas to Europe since Western nations imposed sanctions on the Kremlin following the invasion of Ukraine. Before the war, the European Union (EU) imported about 40% of its natural gas from Russia.
The gas is transported by the Nord Stream system, a pair of offshore natural gas pipeline networks in Europe that run under the Baltic Sea from Russia to Germany.
Russian energy giant Gazprom recently halved the amount of natural gas flowing through the Nord Stream 1 pipeline to 20% of capacity, blaming Western sanctions for a delay in the delivery in a necessary turbine. EU officials say Russia is “weaponizing” its gas supply.
Amid tensions, the EU bloc outlined a plan to phase out dependence on Russian fossil fuels. Lithuania ceased Russian gas imports at the beginning of April. Estonia’s and Latvia’s imports also dropped to zero at the start of that month. Bulgaria, the Netherlands, and Poland all announced that they do not intend to renew long-term contracts with Gazprom.
Despite these efforts, Europe remains dependent on Russia for its supply of natural gas, at least in the short and medium term.


Oil and Gas
How Oil Is Adding Fuel to Geopolitical Fragmentation
Which countries and regions decreased, banned, or increased Russian oil imports following the 2022 invasion of Ukraine?


How Oil Is Adding Fuel to Global Fragmentation
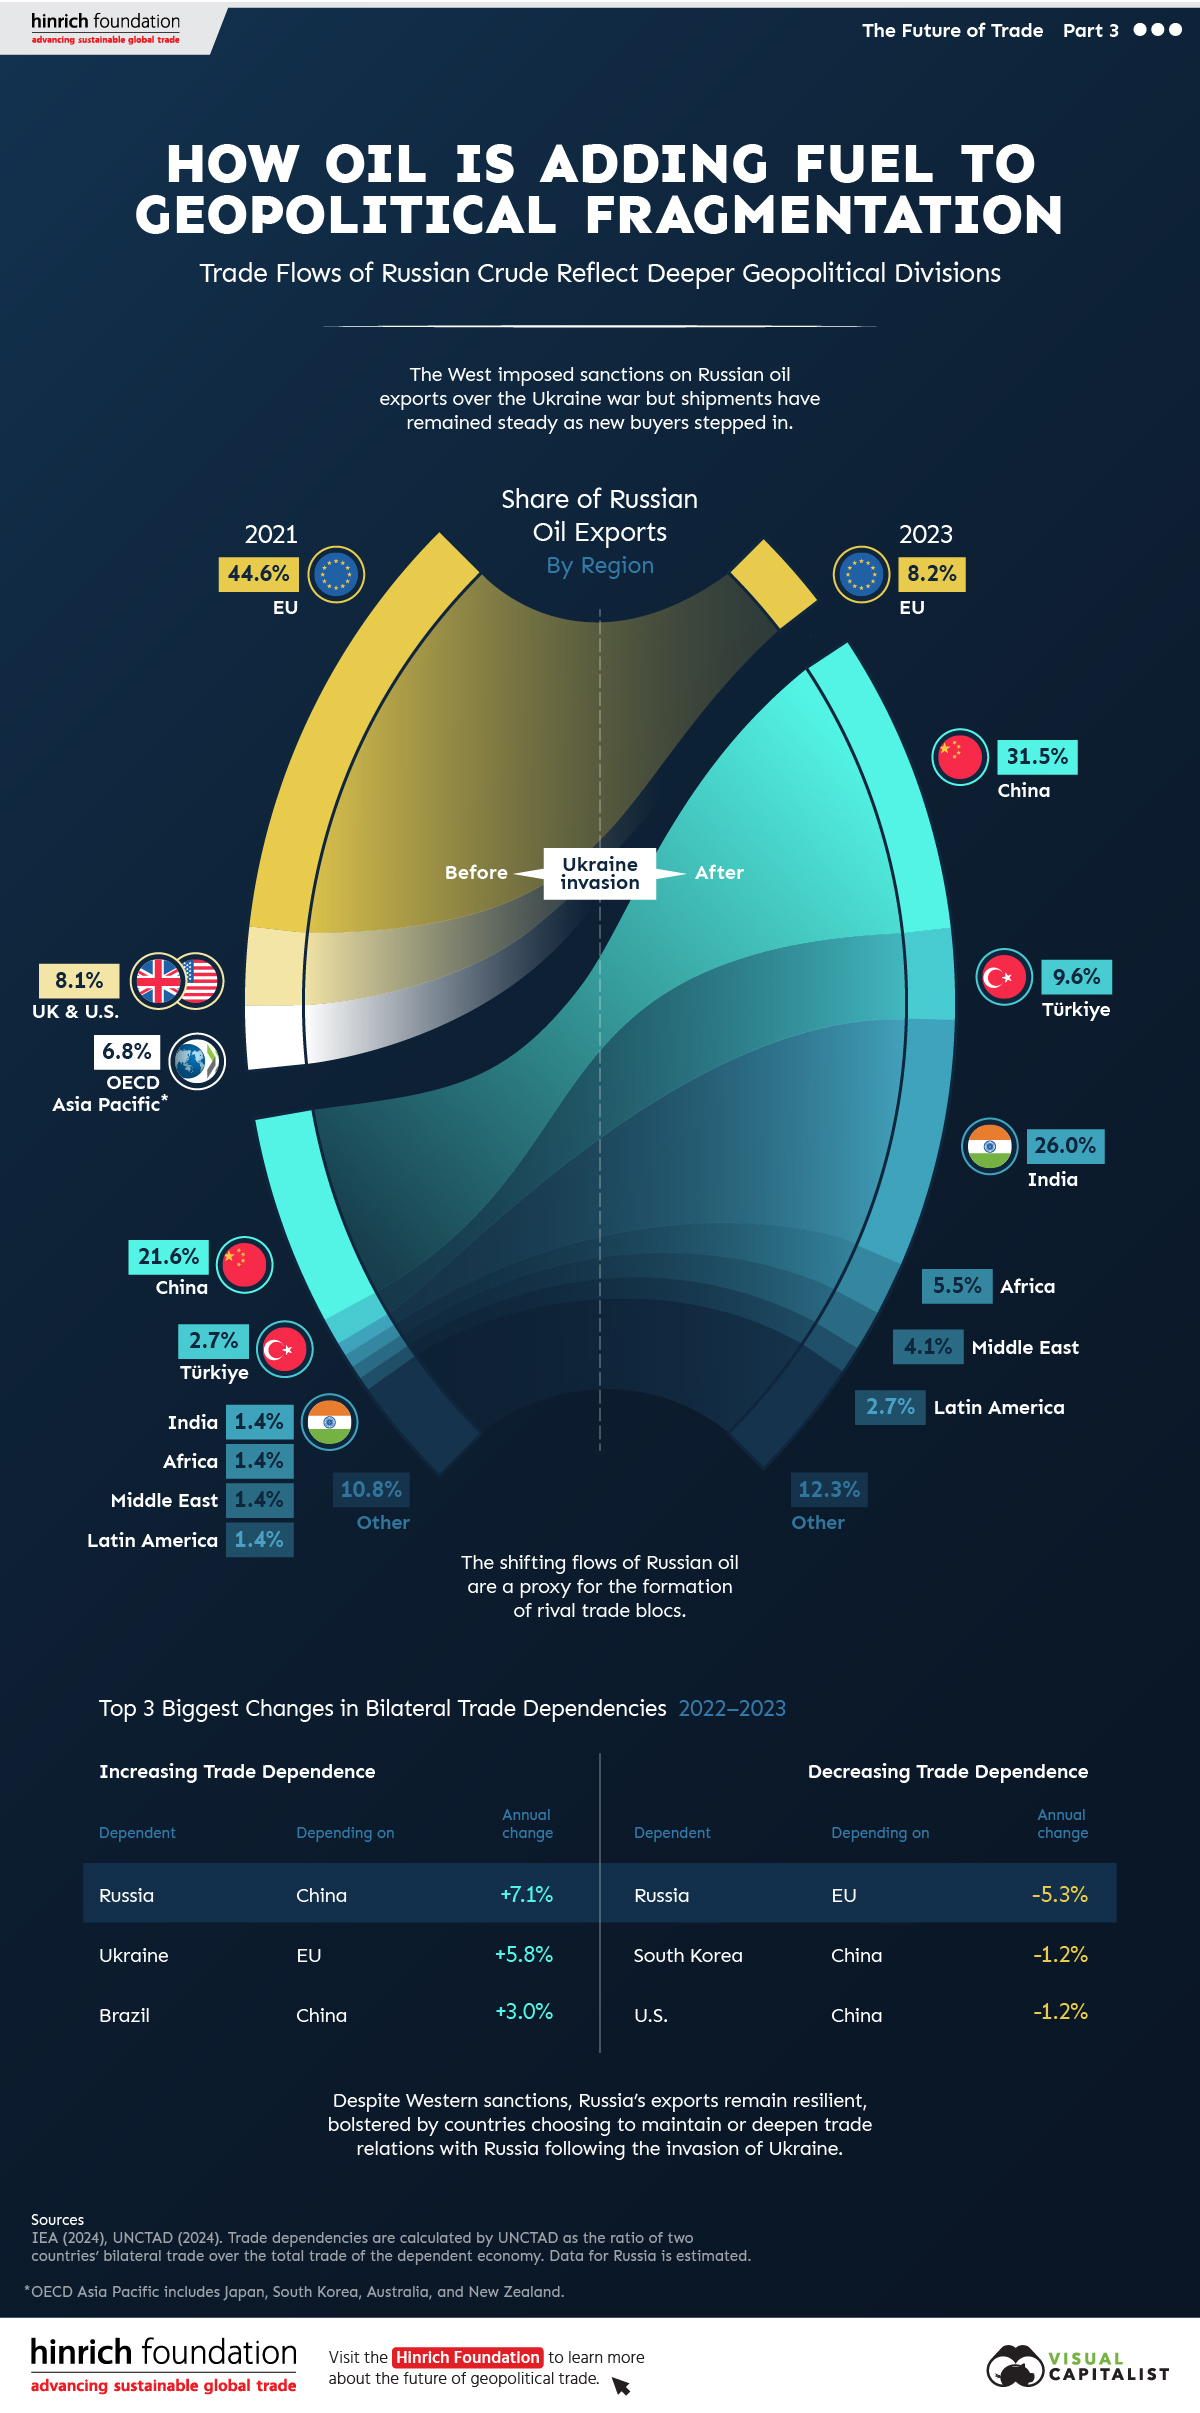
Russia’s invasion of Ukraine in February 2022 led to severe bans or restrictions on Russian oil from the West. Meanwhile, other nations—including China, India, and Türkiye—opted to deepen trade ties with the country.
This graphic from the Hinrich Foundation is the final visualization in a three-part series covering the future of trade. It provides visual context to the growing divide among countries shunning Russian oil versus those taking advantage of the excess supply.
Which Countries Have Decreased or Banned Russian Oil Imports?
This analysis uses data from the IEA’s February 2024 Oil Market Report on Russian oil exports from 2021 to 2023.
Following the invasion, both the U.S. and the UK enacted a complete ban on Russian crude. Imports dropped from 600,000 barrels per day (bpd) in 2021 to zero by late-2022.
| Country/Region | 2021 (bpd) | 2022 (bpd) | 2023 (bpd) | Change; 2021-2023 (bpd) |
|---|---|---|---|---|
| EU | 3.3M | 3.0M | 600K | -2.7M |
| UK & U.S. | 600K | 100K | 0 | -600K |
| OECD Asia | 500K | 200K | 0 | -500K |
Similarly, the EU, which has historically been more reliant on oil from Russia, dropped imports by over 80%, from 3.3 million bpd in 2021 to 600,000 bpd in 2023.
OECD Asia-Pacific—which includes Japan, South Korea, Australia, and New Zealand—also slashed their Russian oil imports.
Which Countries Have Increased Imports of Russian Oil?
The pullback in demand for Russian crude from the West created a buying opportunity for countries and regions that chose not to support Western sanctions.
| Country/Region | 2021 (bpd) | 2022 (bpd) | 2023 (bpd) | Change; 2021-2023 (bpd) |
|---|---|---|---|---|
| India | 100K | 900K | 1.9M | +1.8M |
| China | 1.6M | 1.9M | 2.3M | +700K |
| Türkiye | 200K | 400K | 700K | +500K |
| Africa | 100K | 100K | 400K | +300K |
| Middle East | 100K | 200K | 300K | +200K |
| Latin America | 100K | 100K | 200K | +100K |
| Other | 800K | 600K | 900K | +100K |
India increased its imports of oil from Russia, by the largest amount from 2021 to 2023—up to 1.9 million bpd from only 100,000 bpd.
China, the biggest net importer, also saw a large uptick. The country boosted imports for Russian oil by over 40% over this timeframe. Türkiye increased imports of Russian crude by an additional 500,000 bpd.
Several other regions—such as Africa, the Middle East, and Latin America—saw slight upticks in imports.
Shifting Trade Dependencies
The dynamics present in the global crude market underscore broader trends in Russia’s trade relationships. Russia is becoming increasingly less economically reliant on the West and more reliant on China.
From 2022 to 2023, the largest upward shift in the UNCTAD’s bilateral trade dependency estimates was Russia’s increased reliance upon China (+7.1%).
| Dependent | Depending On | Annual Change |
|---|---|---|
| Russia | China | +7.1% |
| Ukraine | EU | +5.8% |
| Brazil | China | +3.0% |
Note: Trade dependencies are calculated by UNCTAD as the ratio of two countries’ bilateral trade over the total trade of the dependent economy.
In fact, China threw a lifeline to Russia in the aftermath of the Ukraine invasion. The Atlantic Council reported that Chinese exports to Russia have grown 121% since 2021, while exports to the rest of the world have increased by only 29% in the same period.
In contrast, Russia also exhibited a large decrease in reliance on the EU (-5.3%). South Korea and the U.S. have made shifts to further distance themselves from China as geopolitical tensions continue to mount.
| Dependent | Depending On | Annual Change |
|---|---|---|
| Russia | EU | -5.3% |
| South Korea | China | -1.2% |
| U.S. | China | -1.2% |
As the Russian oil market shows, geopolitical tensions have the potential to significantly impact trade. Though Russian crude exports remained steady amid the conflict, this necessitated a shift in its main trading partners.
Visit the Hinrich Foundation to learn more about the future of geopolitical trade

-
 Markets2 weeks ago
Comparing Saudi Aramco’s $1.9T Valuation to Its Rivals
See how much larger Saudi Aramco’s market cap is compared to rivals like Chevron, ExxonMobil, and Shell.
-
 Economy7 months ago
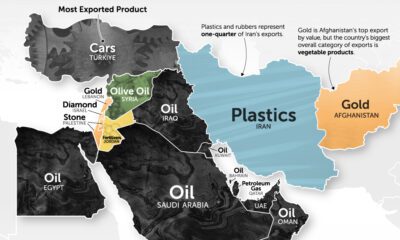
Mapped: The Top Middle East Exports by Country
It’s more than just oil. This map of Middle East exports shows the top global product of each country by value.
-
 Countries9 months ago
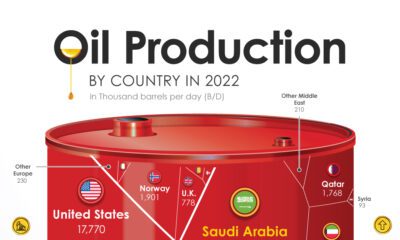
Charted: The World’s Biggest Oil Producers
Just three countries—the U.S., Saudi Arabia and Russia—make up the lion’s share of global oil supply. Here are the biggest oil producers in 2022.
-

 Markets1 year ago
Prediction Consensus: What the Experts See Coming in 2023
Using our database of 500+ predictions from reports, articles, interviews, and more, we highlight what experts think will happen in 2023
-
 Energy2 years ago
Which Countries Produce the Most Natural Gas?
Natural gas prices have risen since Russia’s invasion of Ukraine. This visualization highlights the world’s largest natural gas producers.
-
 Energy2 years ago
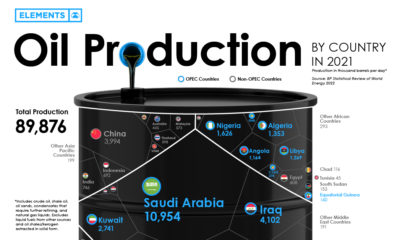
Visualizing the World’s Largest Oil Producers
Global oil production averaged 89.8 million barrels of oil per day in 2021. Here are the world’s largest oil producers.


-

 Cryptocurrency6 days ago
Visualizing the 15 Most Valuable Bitcoin Addresses
-

 Crime2 weeks ago
Visualizing the Companies Online Scammers Impersonate the Most
-
Markets2 weeks ago
Comparing Saudi Aramco’s $1.9T Valuation to Its Rivals
-
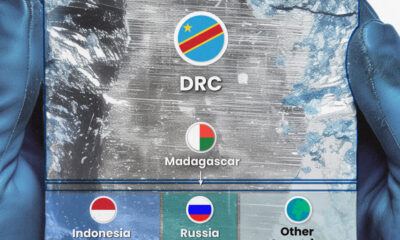
 Mining2 weeks ago
Visualizing Cobalt Production by Country in 2023
-
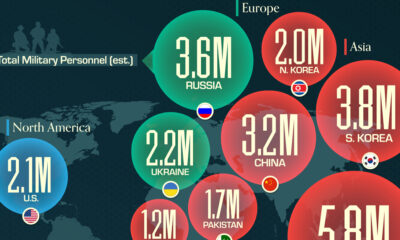
 War2 weeks ago
Mapped: The World’s Largest Armies in 2024
-

 Demographics1 week ago
Charted: America’s Most Popular Baby Names in 2023
-
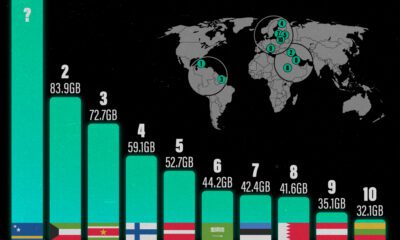
 Technology1 week ago
Visualizing the Top Countries, by Mobile Data Usage
-

 Misc1 week ago
Ranked: Top 10 Deadliest Animals for Humans