Upgrading Our Blog!

We are pleased to announce that we will be upgrading our blog this weekend in order to give greater flexibility in our data presentation.

After this change, you will still be able to find us at europeansnapshot.com.  

Subscriptions should remain intact, though to err on the side of caution, we suggest that our loyal readers check back with us on Monday and re-subscribe after the change takes place. We thank you for your readership and we look forward to continuing to bring you the current European Snapshot!

Europe Continues To Grow

By Thomas Cooley, Charlie Nusbaum, and Peter Rupert

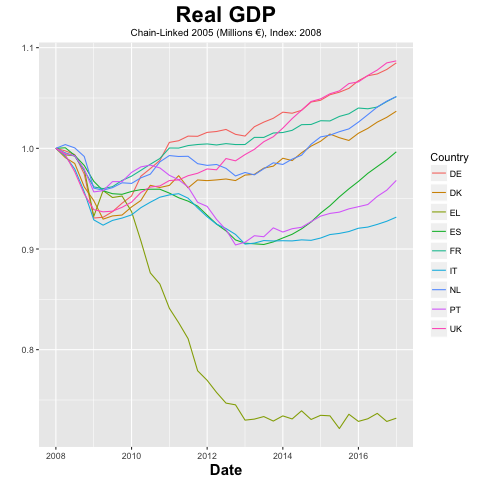
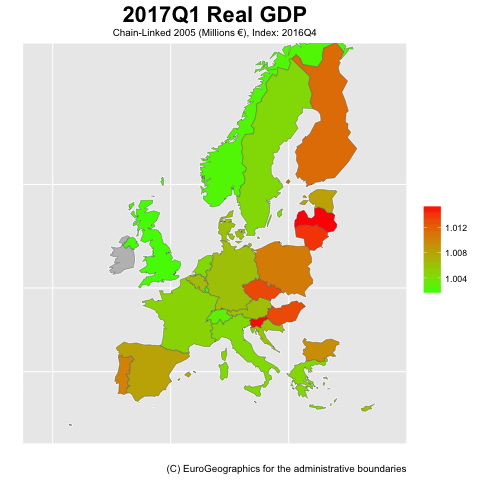
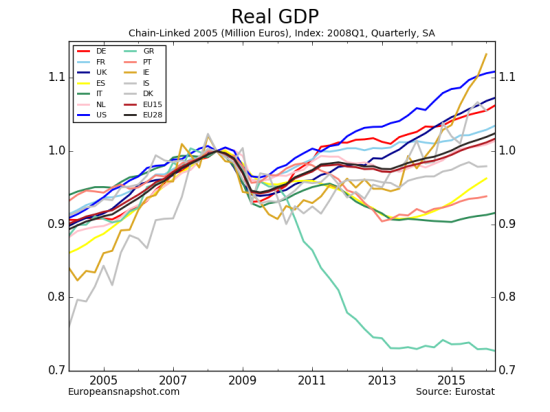
The good year for Europe continues, according to the second quarter numbers released by Eurostat this month. Indeed, annualized quarterly GDP growth for the Euro Area rose from 2.2% to 2.6% during 2017Q2, while that for the Union as a whole increased from 2.2% to 2.7%. At first glance, it may seem as though the EU lags the United States, which grew at an annual rate of 3.0% during the second quarter of 2017 (here). Compared to this time last year, however, the EU grew marginally faster (0.2 percentage points) than the US. gdp_quart_growth_map.png

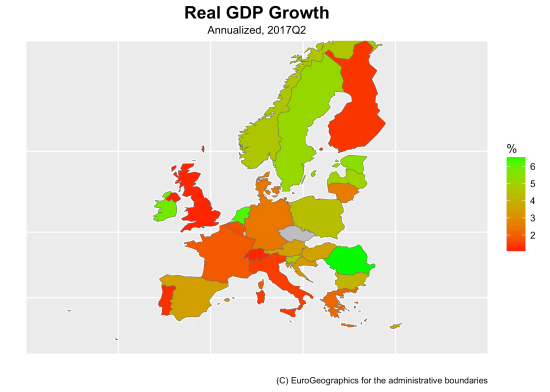
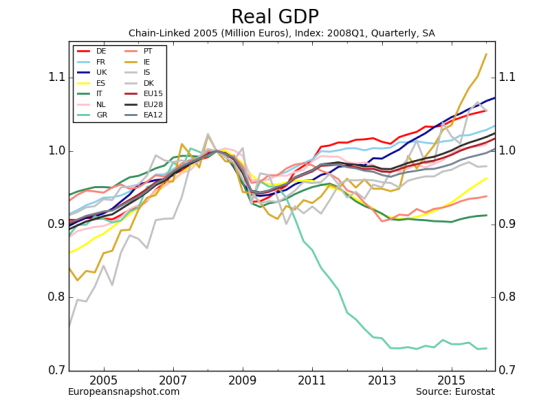
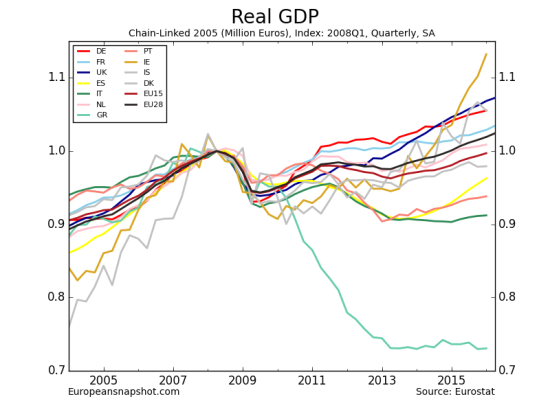
The Czech Republic, which we have omitted here, far outpaced the rest of the EU with an annualized growth rate just over 10%. The Netherlands and Romania also saw significant growth of 6.2% and 6.5%, respectively. Several countries, however, continued to struggle this quarter. Italy, the UK, and France saw meek growth ranging from 1.2%-2.0%. Portugal and Finland also seem to have deflated compared to their first quarter performance with annualized growth decreasing by 2.6 and 3.3 percentage points, respectively.net_exports_growth_maps.png

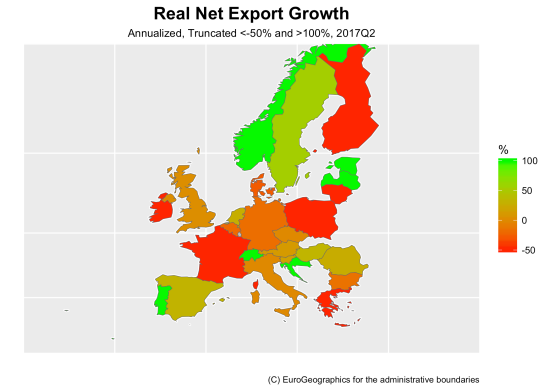
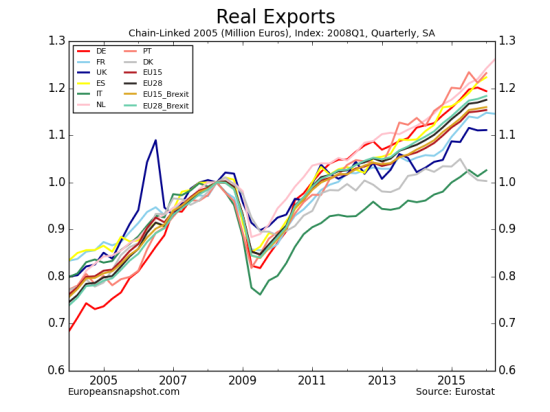
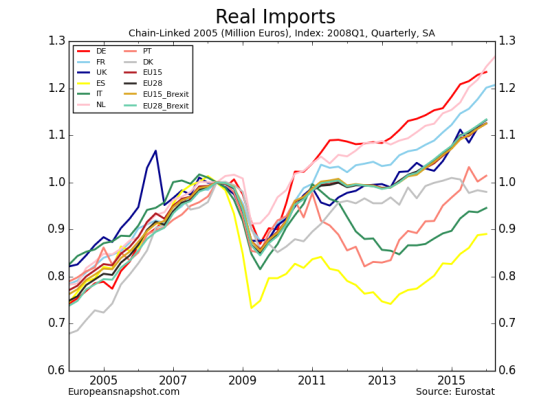
The European Union improved its trade balance as well, with net exports for the EU28 growing at a 10% annualized rate during 2017Q2. Here, we have applied a top- and bottom-code of 100% and -50%, respectively. Clearly,  Portugal, Switzerland, and Norway, among others, more than doubled their net exports this quarter. Ireland, France, and Greece on the other hand, saw their net exports halved. Hungary, Spain, and Sweden also saw high net export growth, ranging from 32% to 55%; whereas Germany, Belgium, and Denmark shrank net exports by 21%-48%.

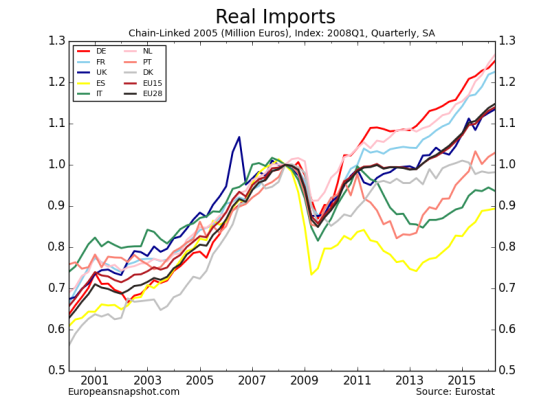
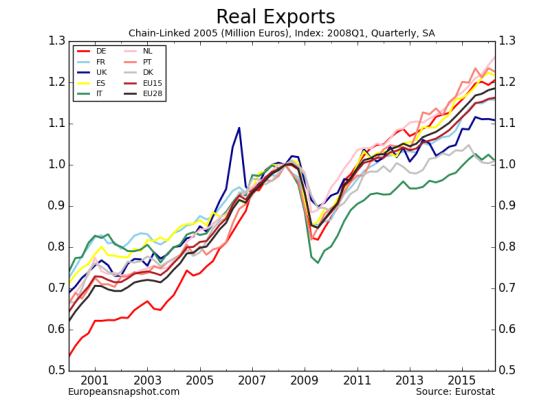
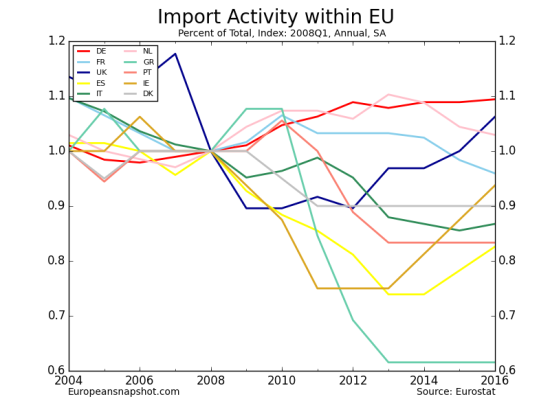
Because international trade can be quite volatile, it is often more instructive to compare the change in imports and exports over the past year, rather than constraining ourselves to a quarterly analysis. Compared to this time last year, the vast majority of EU countries are doing quite well. The Union as a whole saw net exports grow by 6.7% since 2016Q2 and the Euro Area increased the same by almost 10% this past year. The Eastern and Western economies were the primary drivers of this growth with countries such as Hungary, Malta, and Lithuania improving their trade balance by over 50%. Ireland, the UK, and France, experienced more modest yet impressive rates of 45%, 21%, and 20%, respectively. Finland, Poland, and Greece on the other hand decreased their net exports by roughly 50% each. Many of the central European countries also saw negative net export growth, suggesting that the decline in these countries this quarter is part of a long-term trend.netLY_exports_growth_maps

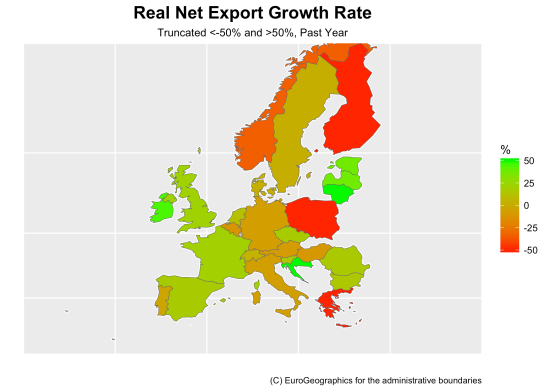
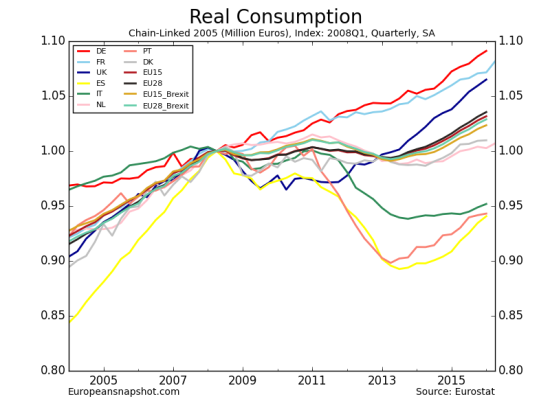
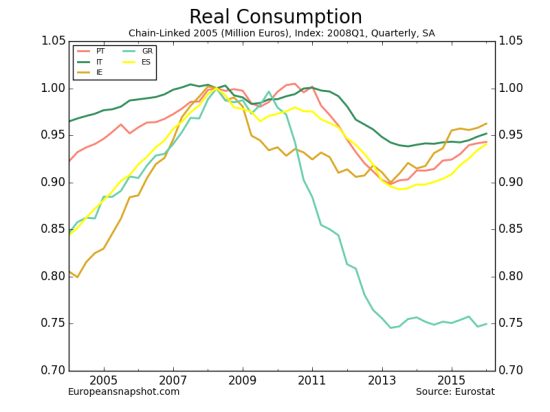
Household consumption maintained its annualized growth of 2% from 2017Q1 through the second quarter. Romania and Ireland, the two poles in this category, experienced a change in household spending on final goods and services of 11.3% and -4.5%, respectively. Save for Portuguese, Lithuanian, and Greek consumers, households from every other country in the EU increased their expenditures.HHCons_growth_map

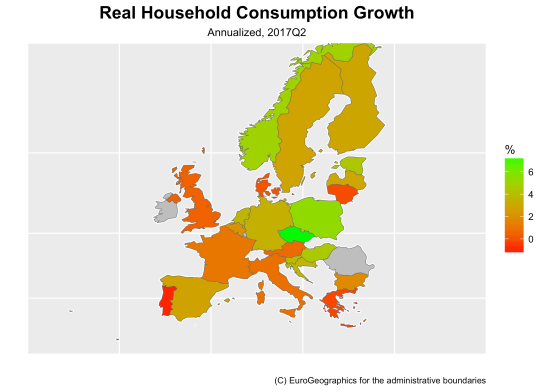
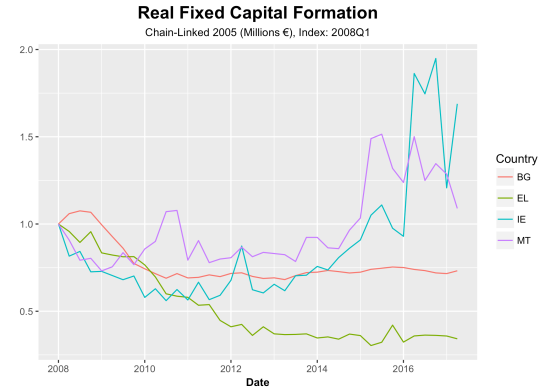
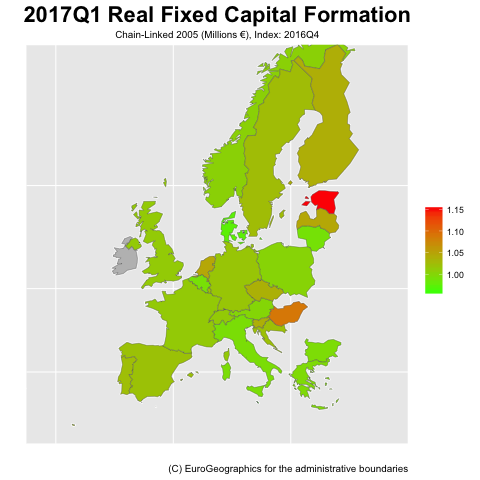
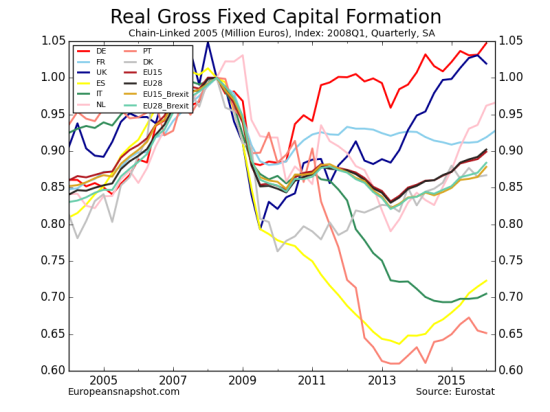
Moreover, capital formation in the EU increased by 2.5% since 2016Q2. The only member countries decreasing their investment in capital are Malta, Greece, Ireland, and Bulgaria.FX_Cap_Form_Growth_map

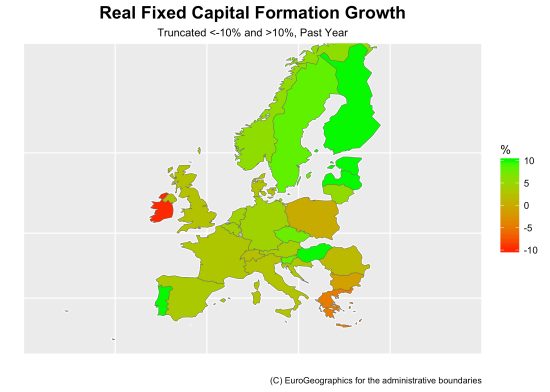
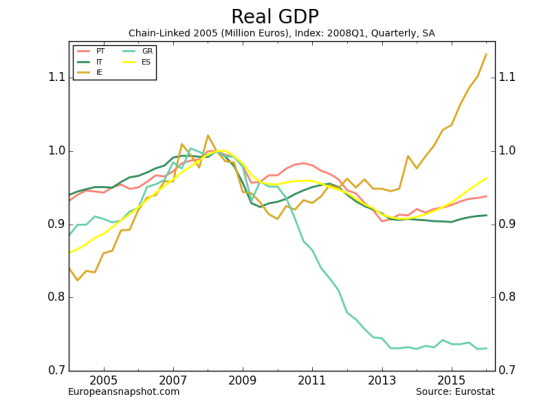
Of these four countries, however, only Bulgaria and Greece remain below their pre-crisis levels in 2008.

FX_Cap_ELIEBGMT_ts

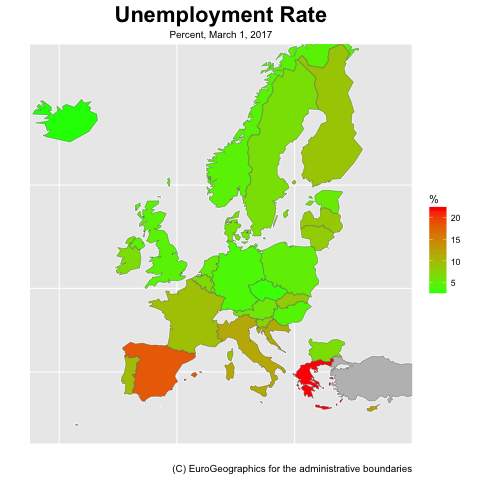
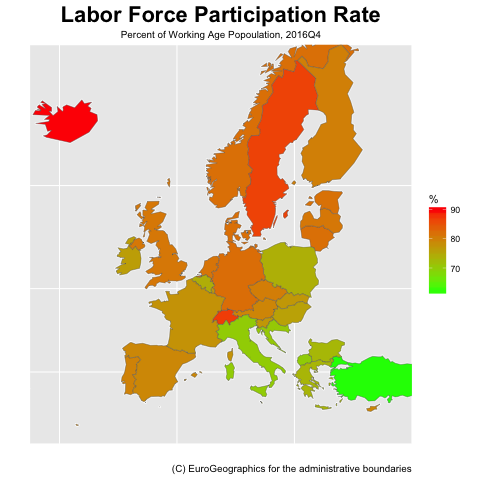
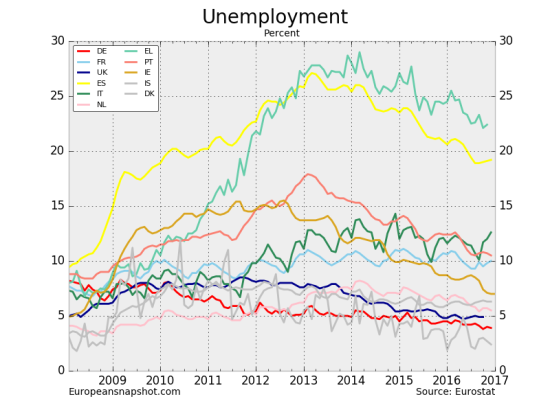
Additionally, the labor market has continued improving through 2017Q2. The Union as a whole decreased its unemployment rate from 8% to 7.7%, a downward trend reflected by almost every member economy.unemp_change

Clearly, however, the Southern European economies are still lagging behind their Northern neighbors. Greece maintained its status as the weakest labor market with an unemployment rate remaining above 20%. The Spanish, Italian, and Croatian labor markets also remain particularly weak with over 10% of their labor force without work. The slow recovery of the French labor market also seems to have stalled. Not only does its unemployment rate remain more than double that of the United States, it also did not enjoy the same decline this quarter as its fellow EU members.unempadj_quart_map

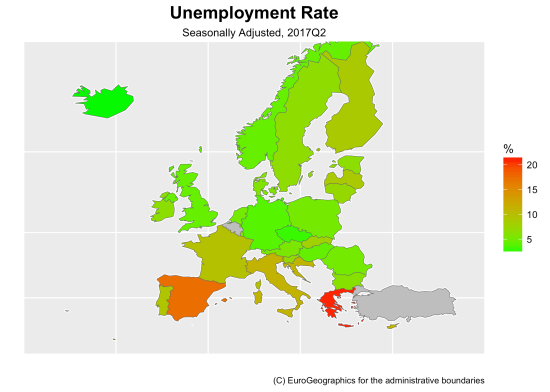
The employment to population ratio continued to improve for most member nations. The 2017Q2 numbers for many countries of interest have not yet been updated by Eurostat. Instead, we report the 2017Q1 numbers for this measure, which were not available to us back in June.emp_quart_ts
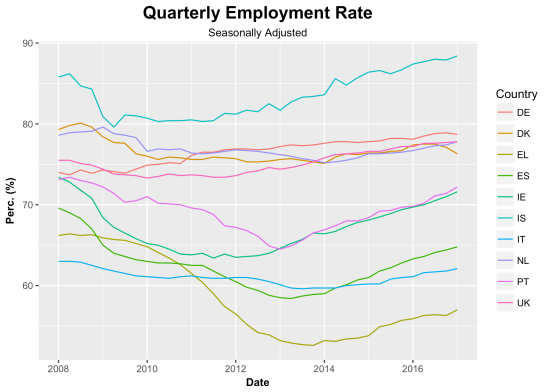
The Beveridge curve for the Union seems to have almost completed its cycle this quarter. Since 2006Q1, however, the match efficiency between unemployed workers and vacancies seems to have decreased as indicated by the outward shift of the red portion of the curve relative to the green portion.EU_Beveridge_Curve

These second quarter numbers give us confidence that things are in fact heading in the right direction for Europe. While there remain several areas of concern detailed here and elsewhere, the promising first quarter of 2017 does not seem to be a fluke.

Are European Banks Holding Back Growth?

By Thomas Cooley, Charlie Nusbaum, and Peter Rupert

Roughly three months ago, Spain’s Banco Popular was bought and saved from complete failure by the Santander Group after it faced a bank run and a total collapse of its stock price. The cause of Banco Popular’s problems can be traced back to the 2008 financial crisis. As several others have recognized (here), Banco Popular maintained a portfolio of almost $40 billion in non-performing loans (i.e. loans over 90 days past due) in its home-market. Compared to its 2016 balance sheet totaling over $100 billion in loans, these failing assets constituted a significant fraction of its portfolio. In light of these events, it is useful to look at the health of the European Banking sector to see if it will be a serious impediment to our optimistic take on European growth and promising signs for the EU economy, detailed in our previous post, or worse, leading to a new financial crisis for Europe.

NPLsGiven that Banco Popular’s problems can be linked in part to its massive portfolio of non-performing loans, this is a natural place to start for the rest of the Union. Indeed, it is evident that the Greek and Cypriot banking sectors are a great risk to their respective economies. During the first quarter of 2017, non-performing loans composed 46% and 43% of all loans in Greece and Cyprus, respectively, numbers above those of even Banco Popular prior to its crash. To get a better picture of the rest of Europe, we removed these two countries from our map.

NPLs_exl_CYEL

It is clear that Greece and Cyprus are not the only countries that are at risk. Portugal, Ireland, and several Eastern European countries hold a relatively high proportion of non-performing loans. Together, these countries display non-performing loan (NPL) ratios of roughly 10.5%-18.5%. While not nearly as worrisome as an NPL ratio of 40%, these banking sectors pose a potential risk, particularly when compared to the 1% NPL ratio seen in the United States. Moreover, Spain seems to be slowly correcting course, decreasing their NPL ratio from 6.3% to 5.5% over the past year. While they still have work to do, Spain appears to be on the right track.

A bank’s ability to absorb losses is also of great concern, here we consider the tier 1 capital ratio, measured as the ratio of retained earnings and shareholder’s equity to total risk-weighted assets. Furthermore, because Estonia’s 37% capital ratio washes out the rest of the graph, we have omitted it. Clearly, Portugal, Italy, and Spain need to do more. With tier 1 capital ratios of roughly 11.5%-12%, they fall well below the EU average of 14%. While they remain both compliant with the Basel III capital requirements for the EU and comparable to three of the six largest US banks, we believe that they should continue to improve this measure in light of shaky profitability indicators that we discuss below. Ireland and the other Southeastern countries, however, seem to have recognized their questionable positions with tier 1 capital ratios closer to 18%-19%.

cap_rat_exl_EE

Several European areas show signs of little to no profitability as well as measured by the return on equity (ROE). To better contrast the remainder of the EU, we have omitted Portugal and Cyprus as they display a ROE for 2017Q1 of -3.2% and -1.2%, respectively. Coupled with their high proportion of NPLs, these abysmal profitability numbers show that Portuguese and Cypriot banks may be in serious trouble. It is also evident that Greece’s 1.3% ROE needs to improve to compensate for their failing loans. While it may seem that Greece is improving due to its 9 percentage point increase in ROE since the end of 2016, there may be a strong cyclical component at work here. Indeed, Greece displayed an almost identical ROE for 2016Q1, but saw large negative returns for the rest of the year. Italy and Ireland, on the other hand, seem to be doing about average in this department, with returns of roughly 7% each. Interestingly, Germany also shows meek returns of only 3.9%. While this is up 1.7 percentage points from this time last year, it is surprising nonetheless. Only the Eastern and Northern EU countries outperformed the 9% average ROE for U.S. banks.

ROE_exl_PTCY

Digging a little deeper, we find that the Greek and Cypriot banking sectors may be in the early stages of a self-correction. With an operating cost-income ratio of only 49% and 54%, respectively, they fall well below both the EU average of 64% and the U.S average of 59%. Portuguese data again indicates trouble with a cost-income ratio of 70%, whereas Irish banks again seem to be in the middle of the pack. Germany is once again surprising in terms of operational efficiency with a cost-income ratio of almost 78%. Though this measure has decreased almost 50 percentage points since 2015, it highlights the need to keep a watchful eye on German banks should the previously detailed risk indicators take a turn. The same can be said for France.

cost_inc_rat

While many 2017Q1 GDP aggregates suggest a good year for the EU, the banking sector warrants concern. Portuguese, Greek, and Cypriot banks show a need for immediate worry in almost every indicator of financial health. Moreover, Irish and Italian banks show potential signs of trouble on the horizon, though the danger does not seem imminent. Banks in the rest of the EU seem to be doing relatively well, though Germany and France could improve from an operational efficiency standpoint.

A Promising New Year For Europe

By Thomas Cooley, Charlie Nusbaum, and Peter Rupert

Eurostat recently released estimates of first quarter GDP for the Eurozone and other EU member nations showing GDP growth of approximately 0.6% (here). Indeed, GDP growth rates increased by 1.9% and 2.1%, respectively, relative to the same time last year. In light of these promising, albeit modest, gains for Europe, we reexamined the Three Europes detailed in a previous post. It now seems that Europe is on a new somewhat brighter path with many countries experiencing renewed growth. To be sure many countries remain below pre-crisis output levels but they have in fact begun to grow.

gdp_quart_ts

The economies of Germany, the Netherlands, and Denmark all remain strong, exceeding their pre-crisis output levels by 3.5%-8.5% with average quarterly GDP growth rates of 0.3%-0.8% since 2014. Moreover, Spain’s growth rate has far exceeded that of any of the northern economies for quite some time now and is on track to catch up with the North should trends continue. Portugal’s economy seems to have gained steam as well while France and Italy continue to see meek growth. The big exception is still Greece which has not yet been resuscitated and remains flatlined roughly 27% below its pre-crisis output. As with previous posts, we have omitted Ireland because it swamps the data and is a bit distorted by the way foreign intellectual capital affects the national accounts.


gdp_quart_2016index_map

First quarter trends are perhaps most easily seen geographically. Here, we see that first quarter European growth has largely been driven by Spain, Portugal, and the Eastern EU countries. Surprisingly, growth in the United Kingdom lagged behind virtually all other member nations since the start of 2017.

Fixed_Cap_Invest_2016index

Moreover, while we can be less certain regarding growth in the next few quarters, we expect these longer term trends to continue or even improve. Indeed, fixed capital formation, the key to economic growth, increased in most countries during 2017Q1 relative to 2016Q4. Capital formation in Greece and Italy seems largely unchanged from the end of 2016, indicating that their growth trends are likely to remain lackluster absent other major interventions going forward.

unemp_month_map

From a labor market perspective, the Tail of Three Europes continues into 2017. Here, we report the March unemployment numbers as Eurostat has yet to update this indicator for all countries of interest. We see that those countries in the North have the lowest unemployment rates and those in the South have the highest, while Central Europe is somewhere in between. Relative to the end of 2016, however, unemployment has decreased in all countries but Denmark, where the unemployment rate is roughly the same as the end of 2016.

LFPR_quart_map

Labor force participation does not seem to follow the same stark geographic trends as unemployment. Here again, 2017Q1 numbers are not yet available for many countries of interest. Instead, we present 2016Q4 numbers. Iceland is the clear winner, with over 90% of its working age population either working or looking for work. Coupled with its low unemployment rate, the labor market in Iceland seems to be the strongest in the Western World. While Iceland is the clear winner, and Turkey and Italy seem to be the losers, the virtual boundaries seen above are absent, rather a more gradual gradient appears here. In other words, the differences between those wanting to work in neighboring countries seems to be small.

eu_exchange_rate_Brexit_ts

Finally, since the end of 2016, the Euro has regained much of its lost ground relative to the dollar. The “collapse of the Euro” as described by some, has stopped. Perhaps a combination of improving performance and a renewed sense of stability resulting from the polls leading up to the French election– and its outcome– have restored confidence in the Union. While a lot can change over the next 6 months, 2017 is showing signs of a good year for Europe.


A Tale of Three Europes

By Thomas Cooley, Ben Griffy, and Peter Rupert

To View This Article in Portuguese go to https://www.homeyou.com/~edu/conto-de-tres-europas.  Our sincere thanks to Artur Weber https://www.homeyou.com/~edu/

One of the great hopes for the European Union and particularly the Eurozone was that removal of national barriers and the free flow of capital and labor would lead to gradual convergence of economic outcomes and well-being.  To some extent that was true up until the financial crisis, but as Warren Buffett once said, “When the tide goes out you see who has been swimming without a bathing suit.” For some European economies, the Great Recession is firmly in the rearview mirror. But now that data for 2016 is complete we have a pretty good picture of the widely different fortunes in Europe.  What we see is that European countries can be divided into three groups, largely along geographic lines. The larger economies of Northern Europe have recovered to levels exceeding the beginning of the recession. The smaller economies of the periphery, especially the South and the East, have struggled, still lagging behind their pre-recession levels for most of the important indicators. And then there’s Greece, whose only positive post-recession has been to keep economists and pundits from referring to the other periphery economies as tragedies. There isn’t really a way to spin it: Greece is in a lot of trouble.

GDP-20170124.png

The northern economies, Germany, the UK, France, and the Netherlands, have all seen timid but consistent growth following the recession. The star of the region has been Ireland, but looks can be deceiving. Much of Ireland’s growth is as a result of global firms relocating their intellectual capital to take advantage of lower Irish taxes. In 2015 Ireland measured growth at 26% much of it illusory because of the relocation of corporate headquarters and intellectual capital. It is more instructive to look at Europe without Ireland as the following chart does.

gdp-20170124-1

Portugal and Spain make up the middle of the pack, having just returned to pre-recession levels. Italy has seen  GDP per-capita fall by nearly 10 percent since the recession. Each of these three countries experienced what looks like a “double-dip” recession, recovering and then bottoming out again in 2012Q4 and 2013Q1. They are all showing signs of recovery, though still lagging behind their northern peers. And at the bottom is Greece, behind by more than 20 percent, and showing few, if any, signs of recovery.

gdp-map-20170124

The labor market looks equally grim and again the labor markets reflect the ongoing structural weakness of the periphery economies and the utter collapse in Greece.

. Employment-20170127-1.png

The same basic groupings of countries show up. Geographically, this pattern is even more clear:

Employment-map-20170124.png

That’s a 10 percentage point decline in employment for countries that are already hurting. Unemployment looks equally as bad:

Unemployment-20170117.png

Spain only fell below 20 percent unemployment midway through 2016, and Greece is still well-above 20 percent unemployment.

Unemployment-map-20170124.png

Once again, the picture gets worse as you move South.

Perhaps the most alarming picture one can present is the path of real gross capital formation. Investment is the bedrock of economic growth.  In the stronger economies it has recovered , or nearly so, to pre-crisis levels. In the middles group  it seems to have settled at about 70% of pre-crisis level. In Greece it has fallen by an almost unbelievable 75%.

capital-20170124-1

Quarterly investment in Greece is now 30 percent of its pre-recession level. That’s what might be expected from a catastrophic war, except there was no war.

capital-map-20170124

Given these divergent fortunes it is clear that the economic recovery from the crisis has been at best uneven.  This makes the stability of the European Union and the Eurozone that much more fragile because one of the chief benefits of unity is not being realized. We should expect to see more evidence of this divergence in the rise and success of populist movements in Europe. Brexit was only the beginning.

Interactive Maps:

NIPA: GDP, Consumption, Government, Fixed Investment, Imports, Exports

Labor Market: Unemployment, Employment-Population Ratio


The Final Countdown

by Thomas Cooley, Ben Griffy, and Peter Rupert

It is now less than 12 hours before we hear the final tally on whether to stay or “Brexit” (British Exit) from the economic coalition known as the European Union. Until recently, it looked likely that the UK would remain a member, but recent polling suggests that the likelihood of either outcome is roughly equal (link). While a British withdrawal from the EU might be easier than a member of the currency union, there is still a lot of uncertainty about what the economic consequences might be. It seems fairly certain that given the instability (economically and politically) in Europe, a withdrawal would not be advised at this point. Here, we discuss what might be the outcomes of such a policy.

Consequences for the UK: Perhaps least clear is the impact upon the UK from an EU exit. Supporters of the referendum broadly base their argument on fears about new immigrants, the merits of which we will not discuss here, rather than economic principles. There are a some economists who have argued that Brexit would improve the UK economy (see here), but we do not find these arguments credible. The most likely consequence of Brexit is a sharp decline in intra-EU trade for the UK. The UK has been among the most active importers and exporters in the EU for some time:Real Imports-13.pngReal Exports-13.png

This second graph is somewhat notable, as the UK has lagged behind many other EU countries during the post-recession period. However, as noted here, the UK has been among the most successful worldwide economies after joining the EU (see “The EU has been good for Britain”). UK economists estimate that GDP could be 1.5 to 3.7 percent lower, with losses in productivity magnifying this loss (link).

In addition, it seems likely that there will be consequences for the UK from the EU directly. The EU could implement sanctions in order to dissuade other economies from leaving, sending the signal that exiting is costly. How large these penalties would be depends upon how strong a signal the leaders of the EU want to send.

Consequences for Europe: As we discussed in a previous post, Brexit would change the dialogue surrounding the European recovery from the Great Recession. Furthermore, the UK is among the most active importers of goods from fellow EU-member states:Import Activity within EU-13_raw.png

And has driven a substantial amount of the recovery during the post-recession period in exports from within the EU:Import Activity within EU-13.png


A larger concern is that a British exit from the EU could lead to countries like The Netherlands exiting the Eurozone as well which would set of a run for the exits. A UK exit could be a signal to these periphery economies that the time is right, and lead to larger problems for the EU. Broadly, Brexit could signal the beginning of the end for the EU economic coalition.

Consequences for the US: Continued uncertainty has harmed recoveries in the United States, and the possibility of a crisis in Europe has contributed to tepid growth in the US (see our companion blog, here, for more recent analysis of the US economy). The United States is certainly more insulated from the effects of Brexit, but any feedback could be damaging for both the US and Europe. The EU economies aggregated are the largest trading partners of the United States, with Eurozone economies importing nearly 250 billion Euro in US goods, and exporting nearly 400 billion Euro in European goods to the US (link).

The results start rolling in at 7 pm PST, with the final tally coming at 11 pm PST. The vote will be a strong signal for the fate of the EU, and potentially of the global economy.

Update (7pm PT): The Guardian is offering live tallies of votes, along with good statistics on the demographics of counties: here.

Brexit and the Eurozone Recovery

by Thomas Cooley, Ben Griffy and Peter Rupert

Much discussion continues about a potential “Brexit,” a British exit from the Eurozone due to the belief that the Eurozone does not help the British economy. Leaving aside the merits of the policy for the UK, we are going to describe the implications of such a policy on the specter of recovery in the EU. As we alluded to in a previous post, the recovery is less-pronounced, and perhaps non-existent if we exclude the UK from figures on GDP. Here, we include observations on additional series  that confirm the same conclusion: the UK is integral to our perception of the Eurozone’s recovery, and its removal would lead to different conclusions about the EU’s economic health. As it stands, the Eurozone has shown a modest recovery, primarily driven by the UK, France, and Germany:Real GDP-14.png

For reference, EU15 is a subset of the Eurozone including the largest economies (link); EU28 includes all 28 Eurozone economies (link). Once we remove the UK from the Eurozone, the post-recession recovery looks as follows:Real GDP-13.png

Zooming in specifically on the aggregated figures,

Real GDP-4.png

Rather than over a year of GDP levels in excess of the Eurozone’s 2008Q1 level, the Eurozone would have breached its 2008 levels just this quarter, according to its EU15 numbers. Specifically, GDP would be 2 percentage points lower, and the recovery would be about four quarters slower than current figures. Other indicators of regional economic health, like consumption and gross fixed capital formation show moderate declines as well, though not at the same scale as rGDP:Real Consumption-13.png

Real Gross Fixed Capital Formation-13.png

The series on fixed capital formation in particular points to an unnerving truth for the Eurozone: the UK has been one of two drivers of the recovery, the other being Germany. While other countries have been scaling back their economies, the UK and Germany have been increasing investment.

But the UK is only one domino in the Eurozone. Obviously there has been much ink spilled over Grexit. There has also been talk of Italy returning to the Lira, which we term a “Rexit.”

Much of the recovery in other European countries appears to be driven by increased exporting activities:Real Exports-13.png

Real Imports-13

If Brexit signals that it’s time for other countries to leave the Eurozone (and equally important, drop the Euro), the consequences could be large for intra-Europe trade.There is much talk in Europe of The Netherlands being the next to go if the U.K. leaves As noted by the ECB (link), trade within member states made up 39% of GDP in 2012. With exports driving much of European growth, a decrease or even a slowdown in exports could put at risk the short-term recovery of the region. The UK vote on Brexit takes place on June 23rd, and is certainly worth following.

Unequal Growth But Evidence of Improvement in Europe

by Thomas Cooley, Ben Griffy and Peter Rupert

Eurostat released estimates of first quarter GDP for the Eurozone a little over a week ago (here), showing modest growth of 0.5% for the more inclusive measure of European countries. This is the 12th quarter in a row that the Eurozone has exhibited positive growth after suffering nearly two years of negative growth 2011-2013. The truth is, however, that the Eurozone has only barely recovered to its pre-recession levels. Furthermore, this growth has been driven by core economies, with countries on the periphery still years away from a full recovery.

As usual, disaggregated data is not yet available for all countries from Eurostat. As we see from the most recent set of available data, a number of countries have recovered beyond their 2008 peaks:Real GDP-15.png

Notably, the large economies of the UK, France (and Germany, though we don’t have the data) are pulling measures of Eurozone health (EU15, EU28, EA12) up above their pre-recession highs. While this is notable, the smaller periphery economies are still lagging well behind. Focusing specifically on these economies (Portugal, Ireland, Italy, Greece, and Spain), we still see an inadequate recovery:

Real GDP-5.png

Greece can only be termed a tragedy at this point; with the exception of Ireland, the rest of the periphery economies are still lagging behind their 2008 peaks. Spain and Portugal have both made substantial recoveries over the past year, and are approaching their pre-recession levels. Much of this recovery has come through a rise in net exports, shown in the following two graphs:

Real Exports-5.pngReal Imports-5.png

But has not translated into increases in consumption, as each economy is still substantially below their pre-recession levels:

Real Consumption-5.png

Additionally, there has been much discussion about the UK leaving the Eurozone. Leaving aside the merits of such a decision for the UK, we wanted to demonstrate their importance to the interpretation of the recovery of the Eurozone. When we remove the UK from the Eurozone and recalculate aggregated recovery statistics, there is a stark difference:Real GDP-14.png

The series “EU15” is here recalculated without the inclusion of the UK. As of 2015Q4, the Eurozone would still be lagging behind their pre-recession levels.

Broadly, while the Eurozone has seen a lot of recovery over the previous year, there is still cause for concern. Namely, the recovery has been very uneven: the periphery economies have seen very little of the growth accrued among the large central economies in the EU (UK, France, Germany, etc.). Furthermore, if the UK were to leave the Eurozone, we would not be talking about this as a remarkable recovery; we would still be describing the tentative recovery of a few core countries, while the rest of Europe lags behind.


Europe Struggles To Lift Off

by Thomas Cooley, Ben Griffy, and Peter Rupert

Fourth Quarter data for 2015 were released this morning by Eurostat. As usual the details for individual countries are lagging behind but the larger picture is clear: the economic recovery in Europe is progressing more slowly than policymakers had hoped, but there are signs of promise. The EU 19 Countries grew at a combined rate of 0.3% which means that the EU grew at roughly 1.5% for the year just past. This is not a hugely encouraging outcome given the aggressive stimulus of the ECB, and the efforts that have been made to improve the soundness of their banks and unify the banking system. But Europe has been beset by terrorist attacks and a refugee crisis as well as a difficult economic environment elsewhere in the world, so slower than expected growth is perhaps not surprising.

As has been true for some time, the aggregate growth results reflect some very different experiences with the U.K., Germany, and now at last Spain growing well, while many of the other countries are flat-lining.  Even leaving out the tragedy of Greece, the economic fortunes of the European partners have been very mixed. Europe as a whole has barely returned to 2008 levels, with a number of the peripheral economies still nearly 10 percent below their pre-recession output levels.  Is the recent improvement strong enough to warrant optimism?  The EU’s trade with China is significant – slightly larger than the United States’ trade with China. Exports to China were $211 billion in 2014. With China slowing down and the Yuan falling this presents a gloomier outlook for Europe.  In addition, the recent weakness of the European banks is another danger signal.

Real GDP-15 If we focus in on some of the larger economies there is at last cause for optimism about a European recovery: even Spain and Italy have returned to growth in the most recent data, although they remain far below their previous levels.

Real GDP-12

The so-called PIIGS–the periphery economies–are a different story but also an improving one. Ireland, Spain, and possibly Portugal are showing signs of growth.

Real GDP-5

Consumption shows much the same picture, but most countries have not returned to anything like their previous peak levels in most economies.

Real Consumption-12

Investment has been very slow to recover in most of the countries and seems to be a major obstacle to recovery in the weakest economies, with several still 20-40% below the 2010 peak. This seems unlikely to improve rapidly, given the unwillingness of firms to invest in an uncertain economic environment.

Real Gross Fixed Capital Formation-12

Exports were showing strong signs of recovery but they have turned down almost everywhere – a sign of the influence of a slowing China and disastrous downturns in Russia, Brazil, and elsewhere.  What should have been helped by a weaker Euro has been hampered by the recent strengthening of the Euro and looser monetary policy on many fronts.

Real Exports-12

Overall, the tragedy of Greece does not seem to be impeding a gradual European recovery. Although the countries are improving at very different paces, the fact that growth has returned more broadly has damped a lot of the dire speculation about the future of the EU. Global concerns will shape much of the outlook for the Eurozone going forward, but the data suggest that most economies in the EU have returned to growth, with larger economies having exceeded their pre-recession levels of output, while the peripheral economies have begun to show signs of recovery.

Europe Grows Apart

by Thomas Cooley, Ben Griffy, and Peter Rupert

Second Quarter data for 2015 are now trickling out of Eurostat. What we see is encouraging evidence of recovery for the major producing countries but a continent that is moving apart. Prior to the financial crisis and the Great Recession the economies were largely growing together but the performance since the crisis has been strikingly different. Even leaving out the tragedy of Greece, the economic fortunes of the European partners have been very mixed.

If we focus in on some of the larger economies there is at last cause for optimism about a European recovery…even Spain and Italy have returned to growth in the most recent data, although they remain far below their previous levels.

The so-called PIIGS–the periphery economies–are a different story but also an improving one. Ireland, Spain, and possibly Portugal are showing signs of growth.

Consumption shows much the same picture, but most countries have not returned to anything like their previous peak levels.

Investment has been very slow to recover in most of the countries and seems to be a major obstacle to recovery in the weakest economies, with several still 20-40% below the 2010 peak.

Government spending is equally varied across these economies. There is however a notable pattern of austerity throughout the continent (and in the U.S.) judging from the pattern of spending.

Exports are showing strong signs of recovery everywhere–strongest in the periphery countries–helped by a weakened Euro.

Euro-USD Exchange Rate-1_raw

Imports are quite varied across the economies reflecting the strength of the recovery in the various countries.

Overall, the tragedy of Greece does not seem to be impeding a gradual European recovery. Although the countries are improving at very different paces the fact that growth has returned more broadly has damped a lot of the dire speculation about the future of the EU.

Employment

Employment in Europe reflects what we saw for GDP growth. For the stronger economies employment has begun to rebound a bit, although the legacy of the Great Recession is a generation of young workers who never entered the labor force in their prime and are permanently impaired as a result.  In the weak economies unemployment remains high and job growth is weak or non-existent.

Employment (15 to 64)-12 Employment (15 to 64)-6 Employment (15 to 64)-5