 Walt DIsney once said: “I try to build a full personality for each of our cartoon characters – to make them personalities.” Today I want to convince you that the same is true of stocks, and that you can trade more profitably if you know the personality of the stocks in your portfolio. But first I need to explain three terms: fundamental analysis, technical analysis, and personality profile.
Fundamental analysis examines the overall economic health of a stock. Analysts pore over financial statements to understand a company’s income, debt and overall profitability, their product lines and market share,in order to predict the company’s growth potential and future share price.
Technical analysis reveals the trading patterns of a stock over time. It begins with the premise that stock prices move in response to news about the company, and over time these movements become predictable. Traders look closely at price and volume of share sales, levels of support and resistance, and identifiable patterns in the trading history of a stock such as its relation to the S&P.
The personality profile of a stock requires technical analysis but also includes options-related information for the stock such as its volatility. We ask, how do this stock and its related options behave? At Tiger Trading, we use the personality profile to select strategies and predict movement in both underlying stock and the price of associated options. Here are some questions we ask of a stock:
Is the stock a loner or a joiner? Does it follow the S&P and the general market, or is it contrarian by nature? Is it a “me too” stock closely following other, bigger companies? Is it excitable? Does it exhibit price spikes, or is it steady and even? Does it change according to the seasons? How quickly does it recover from bad news? Does it have a sugar daddy who steps in and buys whenever the stock sags? Is it sensitive to interest rates, analyst downgrades, or market competition? Do the options swell noticeably during earnings season, even if the price goes nowhere? Does the stock and its associated options move more in response to the announcement of its earnings announcement, or in response to the actual announcement? Does the company deliberately under-estimate earnings, so that there is often an upward surprise?
- Range. Over the last year has the stock gone up, down, or sideways? What is the 3 month and 30 day trend and range and range for the stock? Is the stock in an accumulation or distribution phase? Do option prices reflect these trends, or are they skewed?
[This might help traders place an Iron Condor at the wings of the recent range of a stock. For example: Here we see ISRG trading sideways, and never able to breach the $600 mark, but never going below $450. Traders might sell long-term credit spreads at $600 and $450 a day before earnings announcements and make money on the “volatility crush” within a few days.

- DIrection: What is the direction since the most recent earnings announcement? Does the stock and its associated options move more in response to the announcement of its earnings announcement, or to the actual announcement?
[This information helps traders choose between different strategies in light of an upcoming earnings announcement. EXAMPLE: Before its 10-for-1 split, an “optimistic” stock like MA tended to start moving up a week or two before earnings were announced. This pattern could be profitable traded 90% of the time using ITM Calls which were bought closed a few hours before the announcement came out.

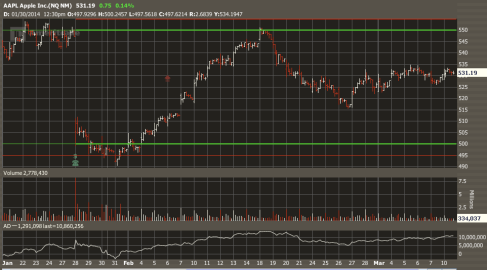
- Recovery: How does the stock respond to a sell-off? Does it look for a bottom quickly, and does it test that bottom? How soon do traders begin accumulating the stock again? If a gap was created, does it fill the gap, or disregard it? [This helps traders to correctly time and place a Bull Put Spread. Here we see AAPL filling a gap in early 2014 after a big drop. If we look back in its history, we see this quite often, hence it is a personality trait of AAPL.

- Settling: How do a stock’s options tend to settle at expiration each month? Do traders seek a popular strike? Do they seem to settle mid way between the highest volume of Calls or Puts? [If true, this would encourage options traders to use Butterfly Spreads.]
Do you know the personality of your favorite stocks?
