
Trading or investing in stocks & commodities is a high risk activity. Any action you choose to take in the markets is totally your own responsibility. You are recommended to make appropriate inquiries and seek appropriate advise before sending money, incurring any expenses, acting on recommendations or entering into any commitment in relation to any reference published here. Past performance is not necessarily indicative of future results.
BIG PICTURE – Pre-Market
Attempting to determine which way a market will go on any given day is merely a guess in which some will get it right and some will get it wrong. Being prepared in either direction intraday for the strongest probable trend is by plotting your longer term charts and utilizing an indicator of choice on the lower time frame to identify the setup and remaining in the trade that much longer. Any chart posted here is merely a snapshot of current technical momentum and not indicative of where price may lead forward.
Kenneth Polcari Morning Thoughts
NQ – Nasdaq Futures
CURRENT PRICE: 5145
Globex Session Trend: DOWNtrend
- High: 5154.5
- Lo: 5140.25
Pre-Market Trend: DOWNtrend
———————————-
Levels to watch in both directions
- Upside: 5156/5166
- Downside: 5117/5078
———————————-
Big Pic (60m, 15m Range Chart)
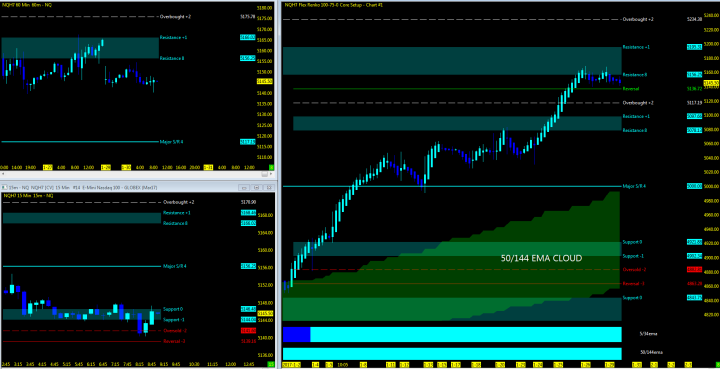
MML Levels
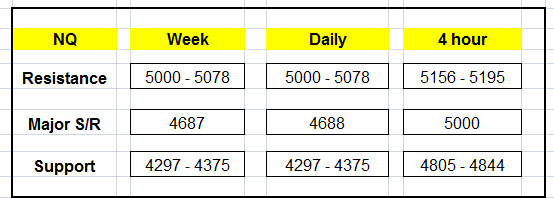
—————————————–
- Nearest Open Daily Gap: 5104
- Lowest Open Gap: 4017
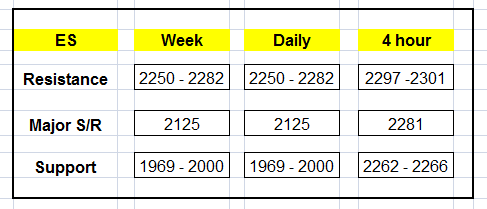
ES – S&P Futures
CURRENT PRICE: 2281
Globex Session Trend: DOWNtrend
- Globex High: 2285.75
- Globex Lo: 2279.25
Pre-Market Trend: DOWNtrend
———————————-
Levels to watch in both directions
- Upside: 2289/2297
- Downside: 2266/2250
Big Pic (60m, 15m Range Chart)
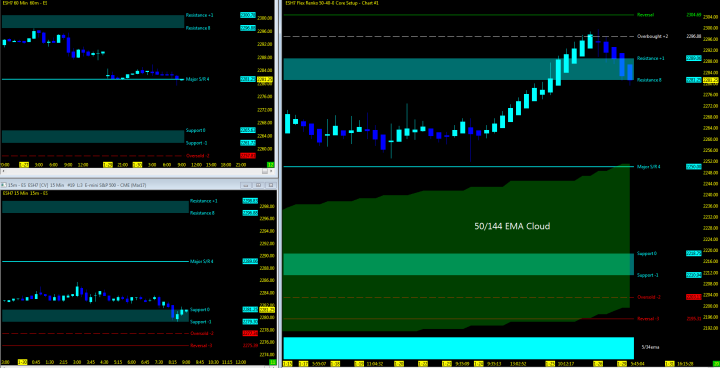
MML Levels
—————————————–
Big Picture – DAILY
- Nearest Open Daily Gap: 2280.5
- Lowest Open Gap: 1860.75
As always, leave your bias at the door of where you think the market should be, watch the charts in front of you and stay away from the Z-Vals. Be ready in both directions. Trend will reveal itself on Heikin Ashi bars and proper trade management will keep you in the trend.
Thanks for reading and remember to always use a stop at/around key technical trend levels.
Don’t forget to view the end-of-the-day charts as momentum in the markets can shift substantially from day to day and reset any charts posted above.
Government Required Risk Disclaimer and Disclosure Statement
CFTC RULE 4.41 – HYPOTHETICAL OR SIMULATED PERFORMANCE RESULTS HAVE CERTAIN LIMITATIONS. UNLIKE AN ACTUAL PERFORMANCE RECORD, SIMULATED RESULTS DO NOT REPRESENT ACTUAL TRADING. ALSO, SINCE THE TRADES HAVE NOT BEEN EXECUTED, THE RESULTS MAY HAVE UNDER-OR-OVER COMPENSATED FOR THE IMPACT, IF ANY, OF CERTAIN MARKET FACTORS, SUCH AS LACK OF LIQUIDITY. SIMULATED TRADING PROGRAMS IN GENERAL ARE ALSO SUBJECT TO THE FACT THAT THEY ARE DESIGNED WITH THE BENEFIT OF HINDSIGHT. NO REPRESENTATION IS BEING MADE THAT ANY ACCOUNT WILL OR IS LIKELY TO ACHIEVE PROFIT OR LOSSES SIMILAR TO THOSE SHOWN.
