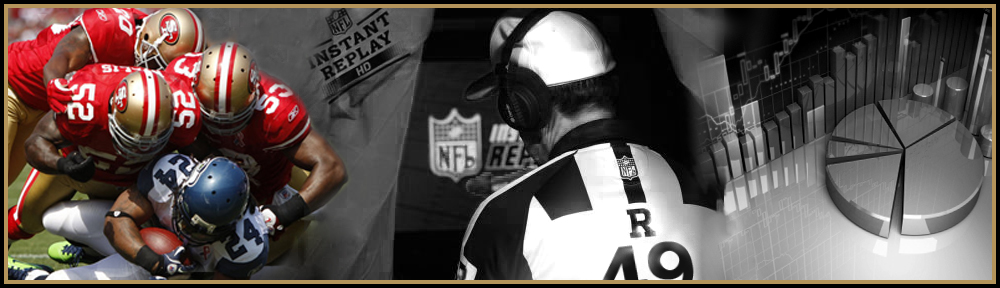
 One of many positive surprises in this year’s NFL are certainly the San Francisco 49ers. Nobody, even the biggest optimists, didn’t dare to predict the success achieved by the 49ers in this season. San Francisco 49ers have clinched playoff berth after Week 14 – winning the NFC West division title for the first time since 2002. They are heading to the playoffs as a No.2 seed in the NFC Playoffs and will be hosting Divisional Playoff game at Candlestick Park.
49ers on offense
Statistically speaking, San Francisco didn’t improve a whole lot on offense from last year, at least if we look at official NFL statistics which measure teams based on yards per game.
2010: Total Offense (313, 24th), Passing yards (210 ,18th), Rushing yards (104, 19th)
2011: Total Offense (311, 26th), Passing yards (183, 29th), Rushing yards (127, 8th)
Looking at this offensive stats one could conclude that the 49ers had a 2010 type of season or maybe even worst season. Offense produced even less yards per game than last year, and considerably less passing yards which is obviously an overrated stat. Teams with more passing yards ended up losing games in more than 50% of games played in regular season. To get a better view on things we need to forget about those misleading stats based on yardage and look at some more reliable stats. Scoring offense is a better way to measure teams’ production on offense. Last year 49ers scored 305 total points, this year 380, with an average of 23.8 per game.
2010: Scoring Offense (19.1, 24th)
2011: Scoring Offense (23.8, 11th)
San Francisco didn’t score that much more points than last year, but still, they have improved in that category compared to 2010 season.
The biggest improvement on offense came from the play of the quarterback position which is by far the most important position on any NFL team. And if we look at individual QB stats again based on yardage we find Alex Smith ranked only 27th with 197 passing yards per game. But he’s been far more efficient than those passing yards stats show. Smith is an elite quarterback if we measure quarterbacks based on TD to INT ratio, he is 2nd best QB in that category with 3.4 ratio only behind Aaron Rodgers.
 Alex Smith 2010:
Yards per game (215, 22nd)
Yards per attempt (6.9, 18th)
Comp % (59.6, 27th)
Passer rating (82.1, 21st)
TD/INT ratio (1.4, 19th)
Alex Smith 2011:
Yards per game (197, 27th)
Yards per attempt (7.1, 17th)
Comp % (61.4, 11th)
Passer rating (90.7, 9th)
TD/INT ratio (3.4, 2nd)
Even dough 49ers showed some improvement on offense, especially with more efficient play from Alex Smith at QB, and a solid running game there’s still a major area of concern on the offense, and that is inconsistent play from 49ers’ offensive line unit.

2010: Sacks (44, tied for 6th most), Yards per carry (4.1, 17th), 3rd down: 31.9%, 29th)
2011: Sacks (44, tied for 7th most), Yards per carry (4.1, 19th), 3rd down: 28.8%, 31st)
O-line has surrendered 44 sacks (31 on the road, 13 in home games), running backs behind that same O-line managed to gain 4.1 yards per carry which is 19th best in the NFL and 49ers converted only 28.8% of their 3rd downs which ranks them 31st in the league, better only of the St. Louis Rams. The O-line unit really didn’t improve a bit from last year.
49ers on defense
One of the major reasons 49ers had such a succesful regular season is their defensive unit. They have been an elite team in almost all defensive statistical measures, and have shown big improvement from last year.
2010: Total Defense (328, 13th), Passing yards (231, 24th), Rushing yards (97, 6th)
2011: Total Defense (308, 4th), Passing yards (231, 16th), Rushing yards (77, 1st)

49ers on defense are the best at stopping the opposing running game and are No.2 scoring defense, allowing only 14.3 points per game.
2010: Scoring Defense (21.6, 16th)
2011: Scoring Defense (14.3, 2nd)
D-line has sacked opposing quarterbacks 42 times (Aldon Smith had 14 sacks in his rookie season), opposing running backs gained only 3.5 yards per carry which ranks 49ers defense as the best in the NFL and 49ers opponents converted only 35.2% of their 3rd downs. Unlike the O-line, 49ers D-line has improved from otherwise already solid 2010 performance.
2010: Sacks (36, 14th), Yards per carry (3.5, 2nd, 3rd down: 38.7%, 19th)
2011: Sacks (42, 7th), Yards per carry (3.5, 1st), 3rd down: 35.2%, 11th)
Team efficiency
If we go back to offensive stats, namely, total yards gained and total points scored we can see that the 49ers managed to score more points on offense with less yards gained if compared to last year. And this brings me to my personal favorite stats, scoreability and bendability index.
Scoreability index is calculated by dividing total yards with total points scored. The result of this calculation is Yards per Point Scored. The lower the number, the more efficiently a team scores points.
Bendability index is calculated by dividing total yards allowed with total points allowed. The result of this calculation is Yards per Point Allowed. The higher the number, the more difficult a team makes it for opponents to score points.
Official NFL stats only measure individual offensive or defensive units. But we all know that the performance of each unit on a team has a direct impact on every other. The scoreability and bendability index are a team-wide measurements of ability to turn yards into points and they both take into account not only teams’ offensive or defensive performance but also include other important factors such as special teams play and turnover ratio.
2010: Scoreability (16.4, 25th) Bendability (15.2, 15th)
2011: Scoreability (13.1, 2nd), Bendability (21.5, 1st)
San Francisco 49ers are great example of how yards really don’t matter, what matters are points scored, and Niners have been scoring points very efficiently. Yards may be important in fantasy football, in real NFL life, on NFL Sundays yards don’t matter. Based on these statistics we can see tremendous progress in this year’s 49ers season compared to last year, mainly because of great play on special teams.  So another way to look at how 49ers really improved as a team from last year is by comparing last season’s average field position with this year’s stats. On offense 49ers have a much better average starting field position, while their opponents quite the contrary.
2010 Average Field Position on offense (29, 25th), defense (30, 15th), net (-1, 19th)
2011 Average Field Position on offense (33, 1st), defense (24, 1st), net (+9, 1st)
As I mentioned above, one of the biggest factors affecting team’s efficiency is turnover ratio. In 2010 49ers were tied for 15th place in the league with -1 turnover ratio, this year 49ers finished with +28 which ranks them as No.1 in the NFL.
And when we add up all those stats we come to biggest stats of all and that can be found in win/loss columns. San Francisco 49ers finished their regular season with a 13-3 record. All of this was possible because San Francisco is currently the best coached team in the NFL and their head-coach Jim Harbaugh is legitimate candidate for coach of the year honor. He and his assistants are getting the maximum out of their team. In my opinion, the difference maker compared to last season, is coach Harbaugh who took the right approach regarding QB Smith, giving him the confidence he needed.
